

Долзарб паттернлар

Двойное дно
сформирован 22.04 в 13:40:19 (UTC+0)
сила сигнала 1 из 5

Сформирована фигура «Двойное дно» на графике GBPJPY M5. Характеристика: Уровень поддержки 187.44; Уровень сопротивления 187.65; Ширина фигуры 21 пунктов. В случае пробоя уровня сопротивления можно будет прогнозировать изменение тенденции, где первая точка фиксации прибыли находится на расстоянии 20 пунктов.
Таймфреймы М5 и М15 могут иметь больше ложных точек входа.
Шунингдек кўринг
- Все
- Все
- Bearish Rectangle
- Bearish Symmetrical Triangle
- Bearish Symmetrical Triangle
- Bullish Rectangle
- Double Top
- Double Top
- Triple Bottom
- Triple Bottom
- Triple Top
- Triple Top
- Все
- Все
- Покупка
- Продажа
- Все
- 1
- 2
- 3
- 4
- 5
Прямоугольник
сформирован 27.05 в 19:45:50 (UTC+0)
сила сигнала 1 из 5
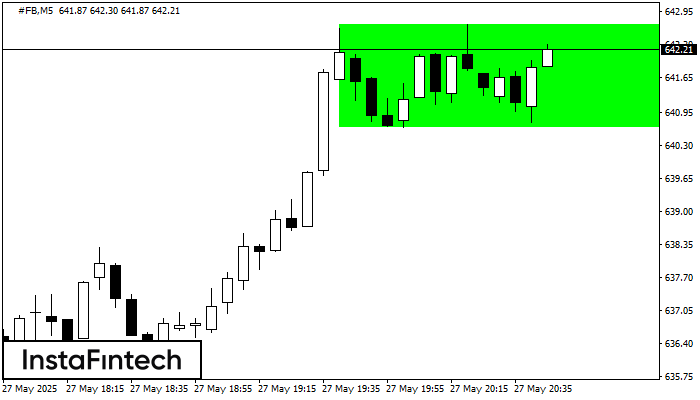
Сформирована фигура «Прямоугольник» на графике #FB M5. Тип фигуры: Продолжение тренда; Границы: Верхняя 642.69, Нижняя 640.66; Сигнал: позицию на покупку следует открывать выше верхней границы прямоугольника 642.69
Таймфреймы М5 и М15 могут иметь больше ложных точек входа.
Открыть график инструмента в новом окне
Двойная вершина
сформирован 27.05 в 19:40:20 (UTC+0)
сила сигнала 1 из 5
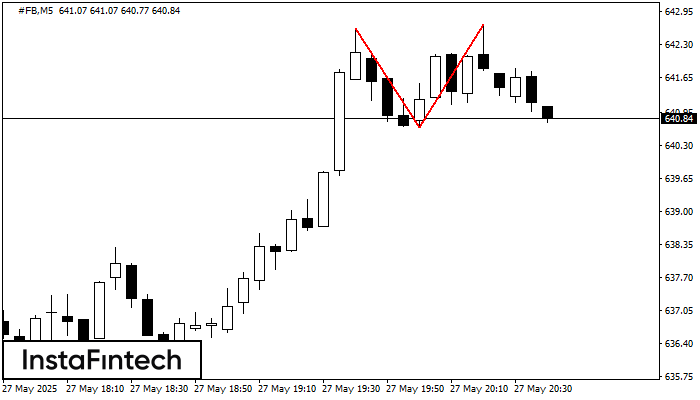
По торговому инструменту #FB на M5 сформировалась фигура «Двойная вершина», которая сигнализирует нам об изменении тенденции с восходящей на нисходящую. Вероятно, что, в случае пробоя основания фигуры 640.66, возможно дальнейшее
Таймфреймы М5 и М15 могут иметь больше ложных точек входа.
Открыть график инструмента в новом окне
Двойная вершина
сформирован 27.05 в 19:35:16 (UTC+0)
сила сигнала 1 из 5
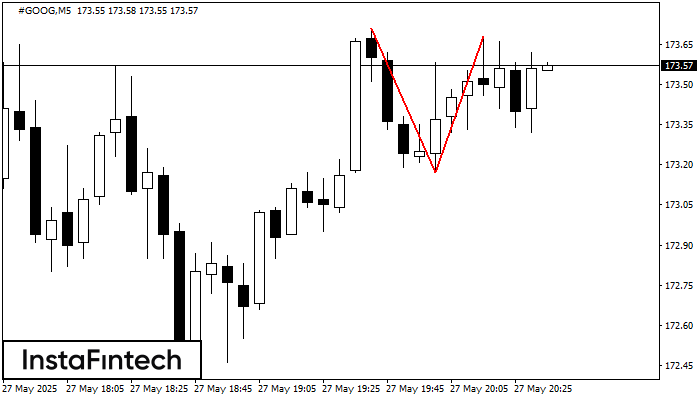
На торговом графике #GOOG M5 сформировалась разворотная фигура «Двойная вершина». Характеристика: Верхняя граница 173.68; Нижняя граница 173.17; Ширина фигуры 51 пунктов. Сигнал: Пробой нижней границы 173.17 приведет к дальнейшему нисходящему
Таймфреймы М5 и М15 могут иметь больше ложных точек входа.
Открыть график инструмента в новом окне


