Двойная вершина
сформирован 22.04 в 06:46:04 (UTC+0)
сила сигнала 1 из 5

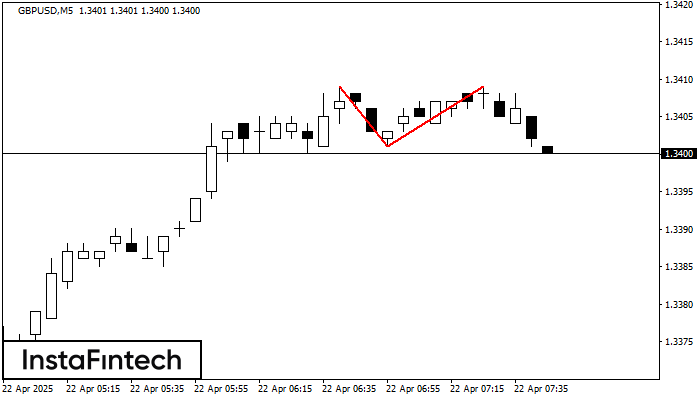
На торговом графике GBPUSD M5 сформировалась разворотная фигура «Двойная вершина». Характеристика: Верхняя граница 1.3409; Нижняя граница 1.3401; Ширина фигуры 8 пунктов. Сигнал: Пробой нижней границы 1.3401 приведет к дальнейшему нисходящему движению с перспективой хода к уровню 1.3386.
Таймфреймы М5 и М15 могут иметь больше ложных точек входа.
- Все
- Все
- Bearish Rectangle
- Bearish Symmetrical Triangle
- Bullish Rectangle
- Double Top
- Double Top
- Triple Bottom
- Triple Bottom
- Triple Top
- Triple Top
- Все
- Все
- Покупка
- Продажа
- Все
- 1
- 2
- 3
- 4
- 5
Bullish Symmetrical Triangle
was formed on 06.05 at 17:58:49 (UTC+0)
signal strength 2 of 5
According to the chart of M15, #KO formed the Bullish Symmetrical Triangle pattern. The lower border of the pattern touches the coordinates 71.18/71.52 whereas the upper border goes across 71.78/71.52
The M5 and M15 time frames may have more false entry points.
Open chart in a new window
Double Top
was formed on 06.05 at 17:45:26 (UTC+0)
signal strength 1 of 5
On the chart of AUDCAD M5 the Double Top reversal pattern has been formed. Characteristics: the upper boundary 0.8937; the lower boundary 0.8927; the width of the pattern 10 points
The M5 and M15 time frames may have more false entry points.
Open chart in a new window
Bearish pennant
was formed on 06.05 at 17:30:46 (UTC+0)
signal strength 3 of 5
The Bearish pennant pattern has formed on the #PEP M30 chart. It signals potential continuation of the existing trend. Specifications: the pattern’s bottom has the coordinate of 130.36; the projection
Open chart in a new window