

Долзарб паттернлар

Бычий симметричный треугольник
сформирован 16.04 в 06:40:55 (UTC+0)
сила сигнала 2 из 5

По AUDCAD на M15 сформировалась фигура «Бычий симметричный треугольник». Нижняя граница фигуры имеет координаты 0.8813/0.8844, при этом верхняя граница 0.8874/0.8844. Формирование фигуры «Бычий симметричный треугольник» наиболее вероятным образом свидетельствует о продолжении восходящего тренда. Это означает, что курс AUDCAD, в случае срабатывания фигуры, пробьет верхнюю границу и направится к значению 0.8867.
Таймфреймы М5 и М15 могут иметь больше ложных точек входа.
- Все
- Все
- Bearish Rectangle
- Bearish Symmetrical Triangle
- Bearish Symmetrical Triangle
- Bullish Rectangle
- Double Top
- Double Top
- Triple Bottom
- Triple Bottom
- Triple Top
- Triple Top
- Все
- Все
- Покупка
- Продажа
- Все
- 1
- 2
- 3
- 4
- 5
Double Bottom
was formed on 28.05 at 14:36:46 (UTC+0)
signal strength 1 of 5
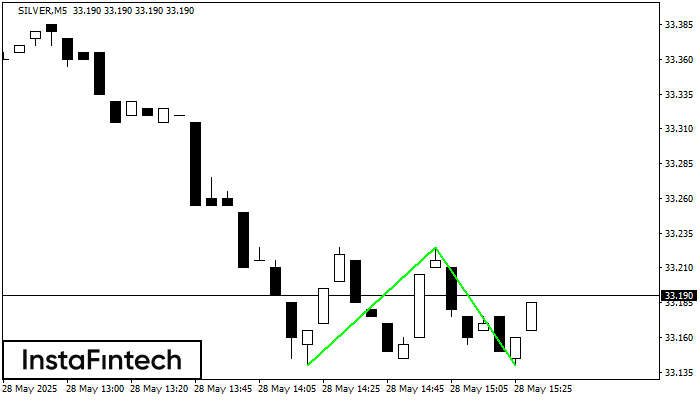
The Double Bottom pattern has been formed on SILVER M5. Characteristics: the support level 33.14; the resistance level 33.23; the width of the pattern 85 points. If the resistance level
The M5 and M15 time frames may have more false entry points.
Open chart in a new window
Bearish Flag
was formed on 28.05 at 14:20:24 (UTC+0)
signal strength 1 of 5
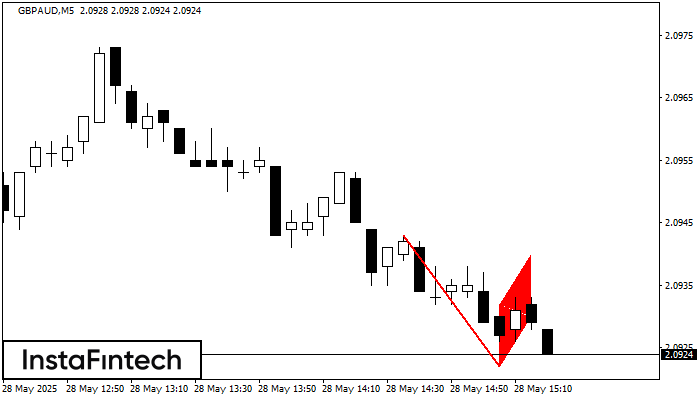
The Bearish Flag pattern has been formed on the chart GBPAUD M5. Therefore, the downwards trend is likely to continue in the nearest term. As soon as the price breaks
The M5 and M15 time frames may have more false entry points.
Open chart in a new window
Bearish pennant
was formed on 28.05 at 14:20:19 (UTC+0)
signal strength 1 of 5
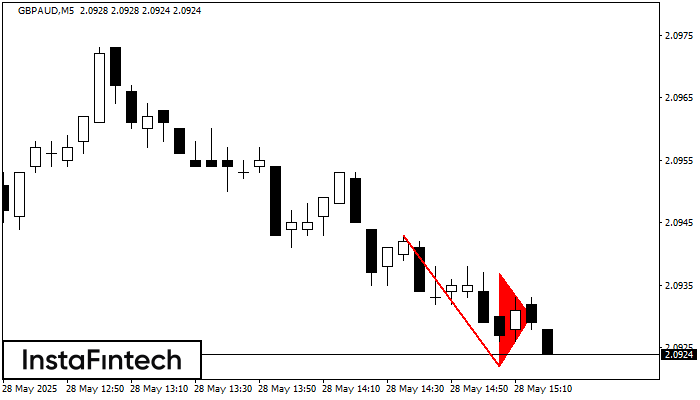
The Bearish pennant pattern has formed on the GBPAUD M5 chart. It signals potential continuation of the existing trend. Specifications: the pattern’s bottom has the coordinate of 2.0922; the projection
The M5 and M15 time frames may have more false entry points.
Open chart in a new window


