

Долзарб паттернлар

Прямоугольник
сформирован 16.04 в 01:07:48 (UTC+0)
сила сигнала 1 из 5
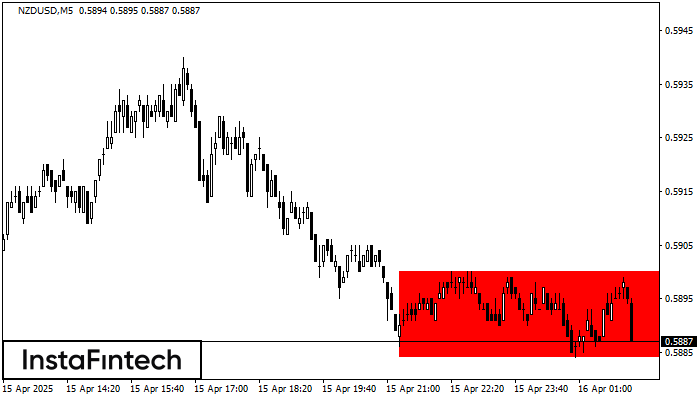
Сформирована фигура «Прямоугольник» на графике NZDUSD M5. Тип фигуры: Продолжение тренда; Границы: Верхняя 0.5900, Нижняя 0.5884; Сигнал: позиция на продажу открывается после фиксации цены ниже границы прямоугольника 0.5884.
Таймфреймы М5 и М15 могут иметь больше ложных точек входа.
Шунингдек кўринг
- Все
- Все
- Bearish Rectangle
- Bearish Symmetrical Triangle
- Bearish Symmetrical Triangle
- Bullish Rectangle
- Double Top
- Double Top
- Triple Bottom
- Triple Bottom
- Triple Top
- Triple Top
- Все
- Все
- Покупка
- Продажа
- Все
- 1
- 2
- 3
- 4
- 5
Triple Bottom
was formed on 28.05 at 22:30:10 (UTC+0)
signal strength 2 of 5
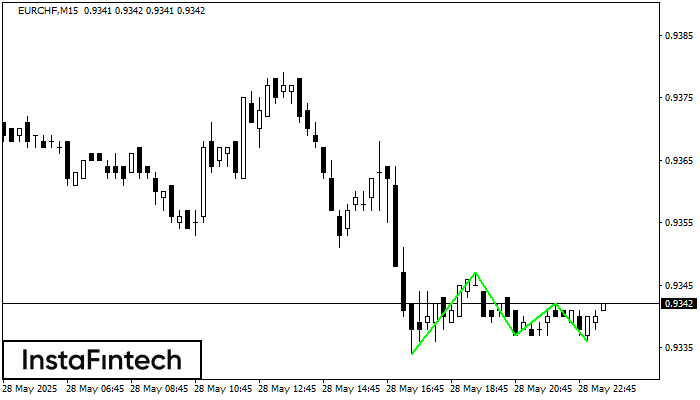
The Triple Bottom pattern has formed on the chart of EURCHF M15. Features of the pattern: The lower line of the pattern has coordinates 0.9347 with the upper limit 0.9347/0.9342
The M5 and M15 time frames may have more false entry points.
Open chart in a new window
Bullish Symmetrical Triangle
was formed on 28.05 at 21:50:36 (UTC+0)
signal strength 1 of 5
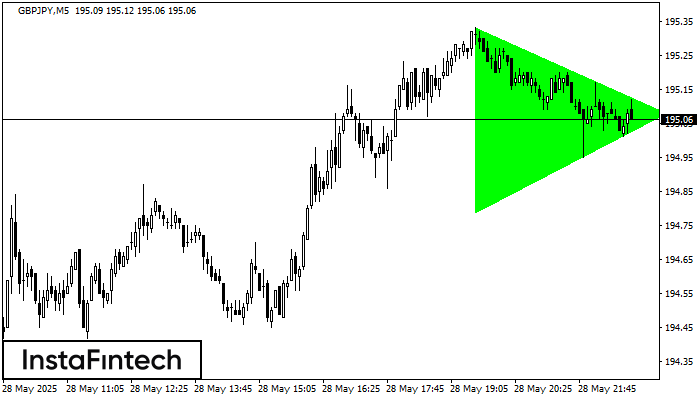
According to the chart of M5, GBPJPY formed the Bullish Symmetrical Triangle pattern. Description: This is the pattern of a trend continuation. 195.33 and 194.79 are the coordinates
The M5 and M15 time frames may have more false entry points.
Open chart in a new window
Bearish Rectangle
was formed on 28.05 at 21:48:16 (UTC+0)
signal strength 1 of 5
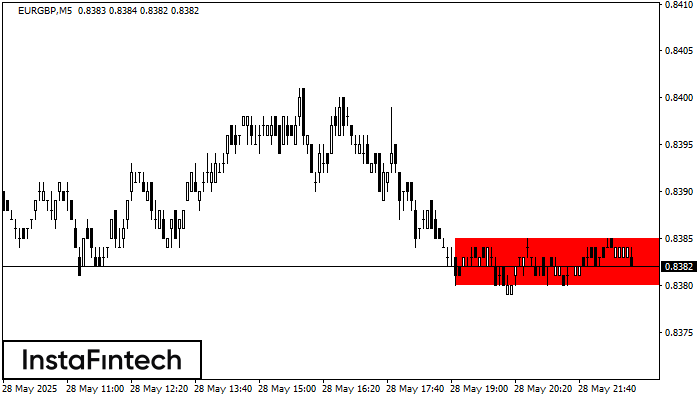
According to the chart of M5, EURGBP formed the Bearish Rectangle which is a pattern of a trend continuation. The pattern is contained within the following borders: lower border 0.8380
The M5 and M15 time frames may have more false entry points.
Open chart in a new window


