

Долзарб паттернлар

Двойная вершина
сформирован 15.04 в 14:00:31 (UTC+0)
сила сигнала 4 из 5
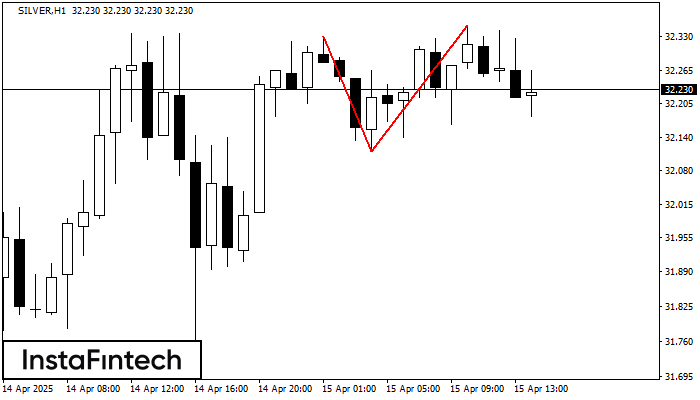
По торговому инструменту SILVER на H1 сформировалась фигура «Двойная вершина», которая сигнализирует нам об изменении тенденции с восходящей на нисходящую. Вероятно, что, в случае пробоя основания фигуры 32.12, возможно дальнейшее нисходящее движение.
Шунингдек кўринг
- Все
- Все
- Bearish Rectangle
- Bearish Symmetrical Triangle
- Bearish Symmetrical Triangle
- Bullish Rectangle
- Double Top
- Double Top
- Triple Bottom
- Triple Bottom
- Triple Top
- Triple Top
- Все
- Все
- Покупка
- Продажа
- Все
- 1
- 2
- 3
- 4
- 5
Triple Bottom
was formed on 30.05 at 20:25:24 (UTC+0)
signal strength 1 of 5
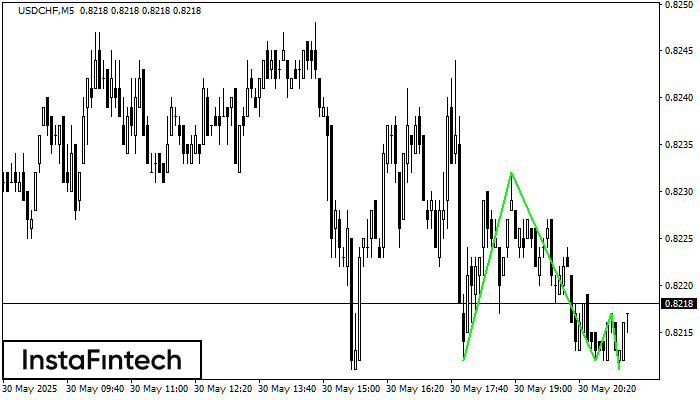
The Triple Bottom pattern has formed on the chart of the USDCHF M5 trading instrument. The pattern signals a change in the trend from downwards to upwards in the case
The M5 and M15 time frames may have more false entry points.
Open chart in a new window
Double Bottom
was formed on 30.05 at 20:10:20 (UTC+0)
signal strength 1 of 5
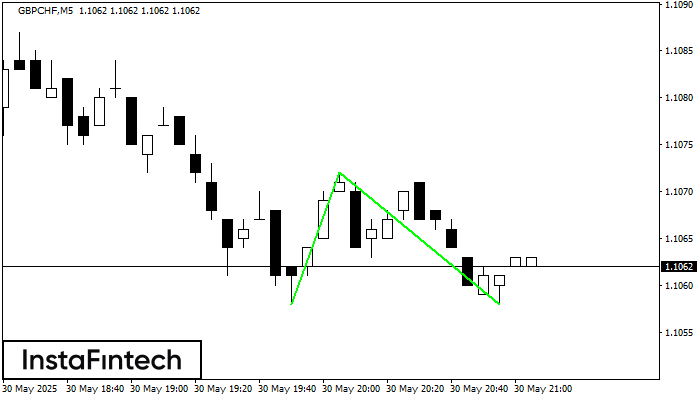
The Double Bottom pattern has been formed on GBPCHF M5. This formation signals a reversal of the trend from downwards to upwards. The signal is that a buy trade should
The M5 and M15 time frames may have more false entry points.
Open chart in a new window
Bearish Symmetrical Triangle
was formed on 30.05 at 20:06:13 (UTC+0)
signal strength 1 of 5
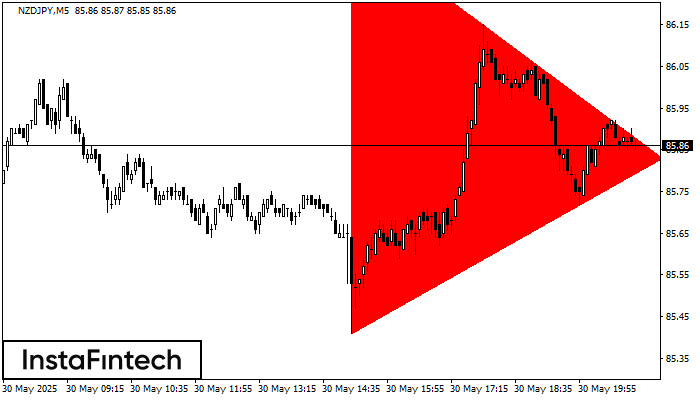
According to the chart of M5, NZDJPY formed the Bearish Symmetrical Triangle pattern. Description: The lower border is 85.41/85.83 and upper border is 86.39/85.83. The pattern width is measured
The M5 and M15 time frames may have more false entry points.
Open chart in a new window


