

Долзарб паттернлар

Прямоугольник
сформирован 15.04 в 12:08:27 (UTC+0)
сила сигнала 3 из 5
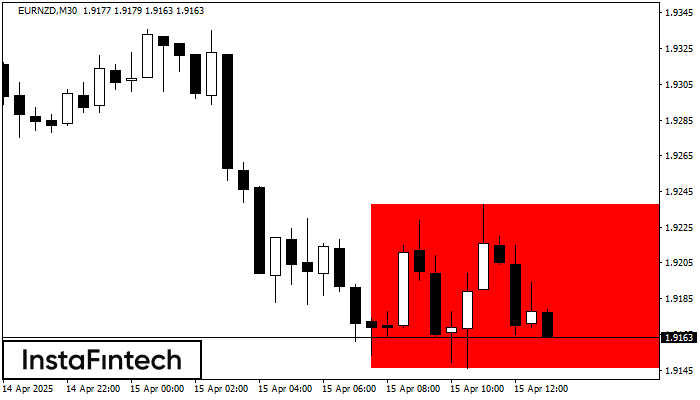
По торговому инструменту EURNZD на M30 сформировалась фигура продолжения тренда - «Прямоугольник». Фигура имеет границы: Нижняя 1.9146; Верхняя 1.9238. В случае пробоя нижней границы вероятно дальнейшее движение в сторону тренда.
- Все
- Все
- Bearish Rectangle
- Bearish Symmetrical Triangle
- Bearish Symmetrical Triangle
- Bullish Rectangle
- Double Top
- Double Top
- Triple Bottom
- Triple Bottom
- Triple Top
- Triple Top
- Все
- Все
- Покупка
- Продажа
- Все
- 1
- 2
- 3
- 4
- 5
Double Bottom
was formed on 14.05 at 16:50:44 (UTC+0)
signal strength 1 of 5
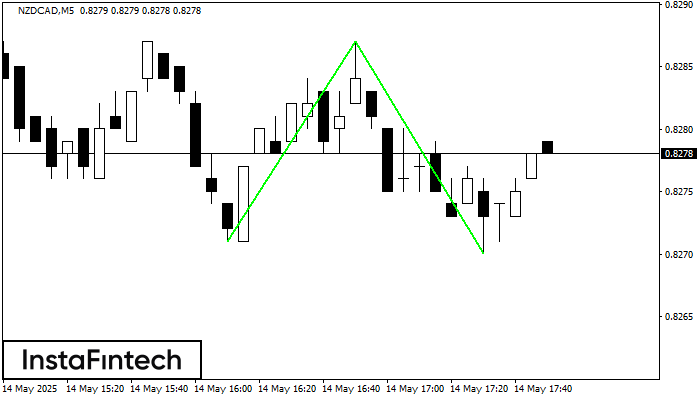
The Double Bottom pattern has been formed on NZDCAD M5. Characteristics: the support level 0.8271; the resistance level 0.8287; the width of the pattern 16 points. If the resistance level
The M5 and M15 time frames may have more false entry points.
Open chart in a new window
Double Bottom
was formed on 14.05 at 16:50:17 (UTC+0)
signal strength 1 of 5
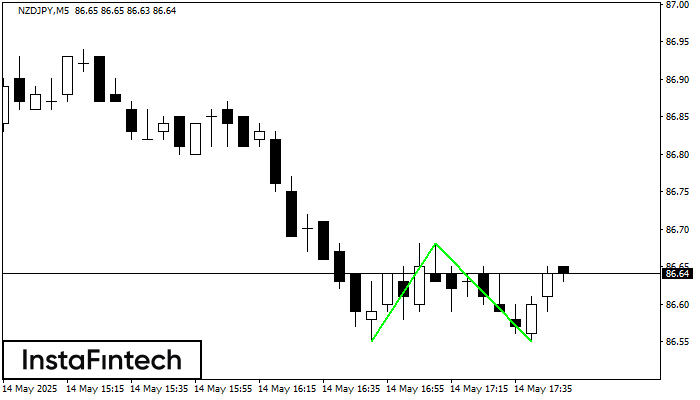
The Double Bottom pattern has been formed on NZDJPY M5. Characteristics: the support level 86.55; the resistance level 86.68; the width of the pattern 13 points. If the resistance level
The M5 and M15 time frames may have more false entry points.
Open chart in a new window
Bearish Flag
was formed on 14.05 at 16:32:33 (UTC+0)
signal strength 1 of 5
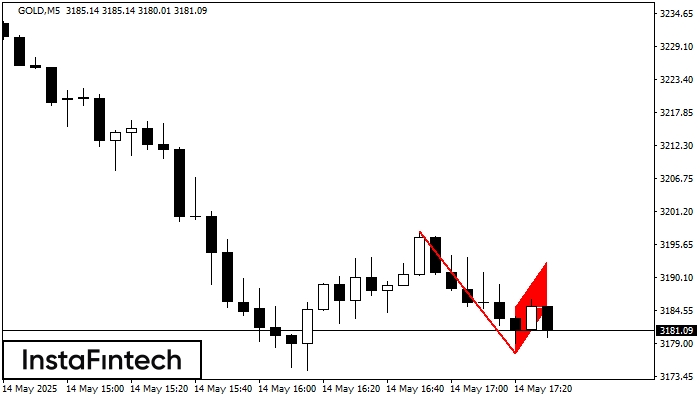
The Bearish Flag pattern has been formed on GOLD at M5. The lower boundary of the pattern is located at 3177.35/3185.07 while the upper boundary lies at 3185.27/3192.99. The projection
The M5 and M15 time frames may have more false entry points.
Open chart in a new window


