

Долзарб паттернлар

Прямоугольник
сформирован 15.04 в 12:03:16 (UTC+0)
сила сигнала 1 из 5
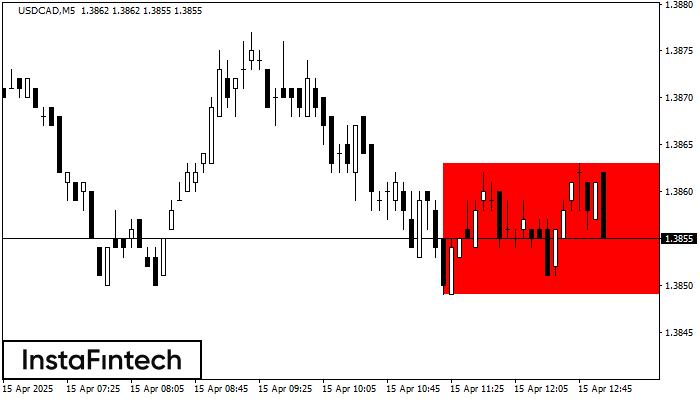
Сформирована фигура «Прямоугольник» на графике USDCAD M5. Тип фигуры: Продолжение тренда; Границы: Верхняя 1.3863, Нижняя 1.3849; Сигнал: позиция на продажу открывается после фиксации цены ниже границы прямоугольника 1.3849.
Таймфреймы М5 и М15 могут иметь больше ложных точек входа.
Шунингдек кўринг
- Все
- Все
- Bearish Rectangle
- Bearish Symmetrical Triangle
- Bearish Symmetrical Triangle
- Bullish Rectangle
- Double Top
- Double Top
- Triple Bottom
- Triple Bottom
- Triple Top
- Triple Top
- Все
- Все
- Покупка
- Продажа
- Все
- 1
- 2
- 3
- 4
- 5
Прямоугольник
сформирован 28.05 в 17:36:39 (UTC+0)
сила сигнала 1 из 5
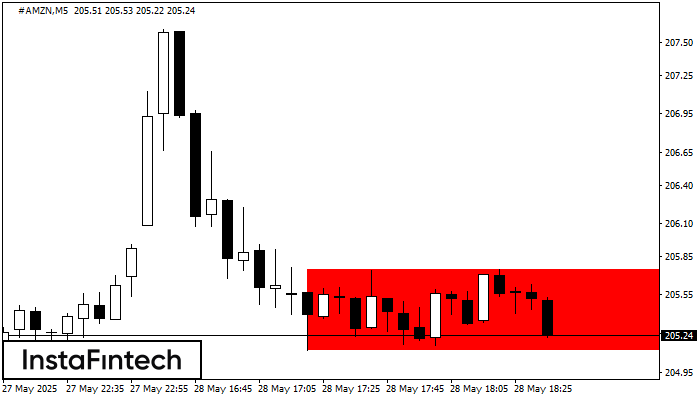
По #AMZN M5 сформировалась фигура - «Прямоугольник». Фигура данного типа относится к тому типу продолжения тренда, который имеет два уровня: Сопротивление 205.75; Поддержка 205.12. В случае пробоя уровня поддержки 205.12
Таймфреймы М5 и М15 могут иметь больше ложных точек входа.
Открыть график инструмента в новом окне
Бычий симметричный треугольник
сформирован 28.05 в 17:35:33 (UTC+0)
сила сигнала 1 из 5
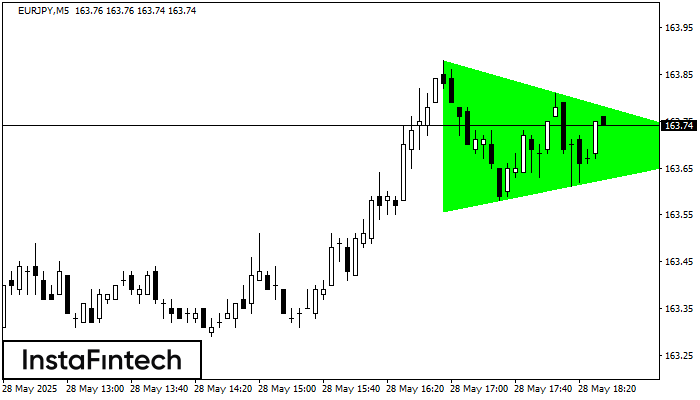
По EURJPY на M5 фигура «Бычий симметричный треугольник». Характеристика: Фигура продолжения тренда; Координаты границ – верхняя 163.88, нижняя 163.56. Проекция ширины фигуры 32 пунктов. Прогноз: В случае пробоя верхней границы
Таймфреймы М5 и М15 могут иметь больше ложных точек входа.
Открыть график инструмента в новом окне
Двойное дно
сформирован 28.05 в 17:35:28 (UTC+0)
сила сигнала 1 из 5
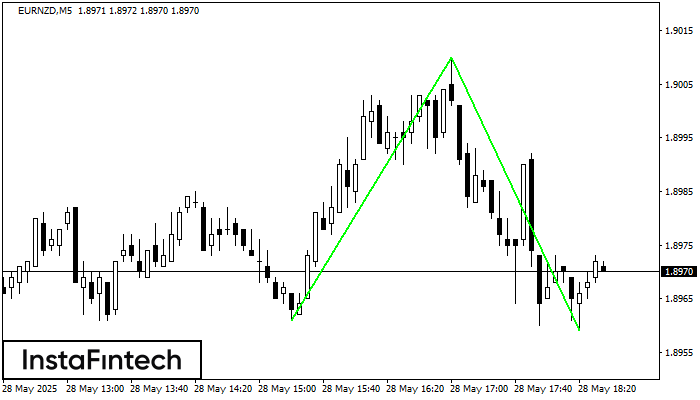
Сформирована фигура «Двойное дно» на графике EURNZD M5. Верхняя граница 1.9010; Нижняя граница 1.8959; Ширина фигуры 49 пунктов. В случае пробоя верхней границы 1.9010 можно будет прогнозировать изменение тенденции
Таймфреймы М5 и М15 могут иметь больше ложных точек входа.
Открыть график инструмента в новом окне


