

Долзарб паттернлар

Тройная вершина
сформирован 15.04 в 08:00:07 (UTC+0)
сила сигнала 3 из 5
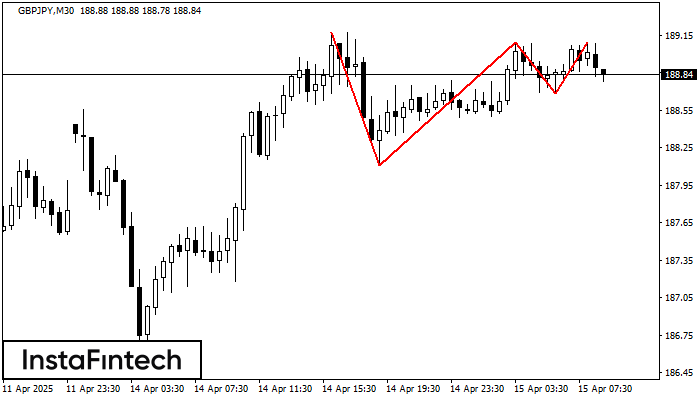
На графике GBPJPY M30 образовалась фигура «Тройная вершина». Данная фигура относится к типу разворотных и имеет характеристику: Верхняя граница 189.17/189.09; Нижняя граница 188.11/188.68; Ширина фигуры 41 пунктов. Прогноз: В случае пробоя нижней границы 188.11 вероятно дальнейшее нисходящее движение к уровню 188.79.
- Все
- Все
- Bearish Rectangle
- Bearish Symmetrical Triangle
- Bearish Symmetrical Triangle
- Bullish Rectangle
- Double Top
- Double Top
- Triple Bottom
- Triple Bottom
- Triple Top
- Triple Top
- Все
- Все
- Покупка
- Продажа
- Все
- 1
- 2
- 3
- 4
- 5
Double Bottom
was formed on 02.06 at 01:00:44 (UTC+0)
signal strength 3 of 5
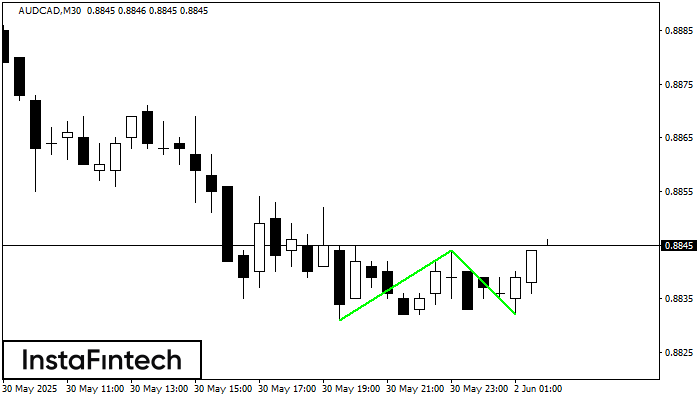
The Double Bottom pattern has been formed on AUDCAD M30. Characteristics: the support level 0.8831; the resistance level 0.8844; the width of the pattern 13 points. If the resistance level
Open chart in a new window
Bullish pennant
was formed on 02.06 at 00:35:10 (UTC+0)
signal strength 1 of 5
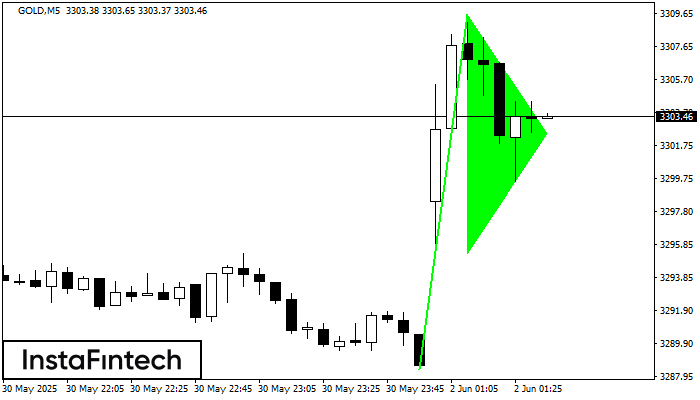
The Bullish pennant pattern is formed on the GOLD M5 chart. It is a type of the continuation pattern. Supposedly, in case the price is fixed above the pennant’s high
The M5 and M15 time frames may have more false entry points.
Open chart in a new window
Double Bottom
was formed on 02.06 at 00:30:12 (UTC+0)
signal strength 2 of 5
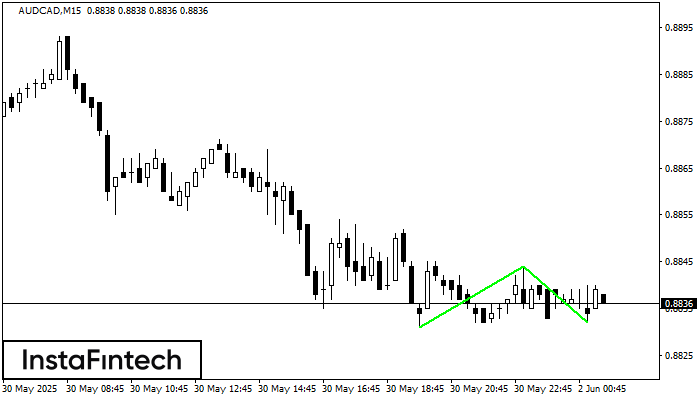
The Double Bottom pattern has been formed on AUDCAD M15. This formation signals a reversal of the trend from downwards to upwards. The signal is that a buy trade should
The M5 and M15 time frames may have more false entry points.
Open chart in a new window


