

Долзарб паттернлар

Тройное дно
сформирован 15.04 в 01:15:13 (UTC+0)
сила сигнала 1 из 5

По торговому инструменту #Bitcoin на M5 была сформирована графическая фигура «Тройное дно» с характеристиками: Уровень сопротивления 84653.62; Уровень поддержки 84425.81; Ширина 22781 пунктов. В случае пробоя уровня сопротивления 84720.65 котировка, скорее всего, продолжит восходящее движение как минимум на 34280 пунктов.
Таймфреймы М5 и М15 могут иметь больше ложных точек входа.
- Все
- Все
- Bearish Rectangle
- Bearish Symmetrical Triangle
- Bearish Symmetrical Triangle
- Bullish Rectangle
- Double Top
- Double Top
- Triple Bottom
- Triple Bottom
- Triple Top
- Triple Top
- Все
- Все
- Покупка
- Продажа
- Все
- 1
- 2
- 3
- 4
- 5
Прямоугольник
сформирован 29.05 в 13:36:16 (UTC+0)
сила сигнала 1 из 5
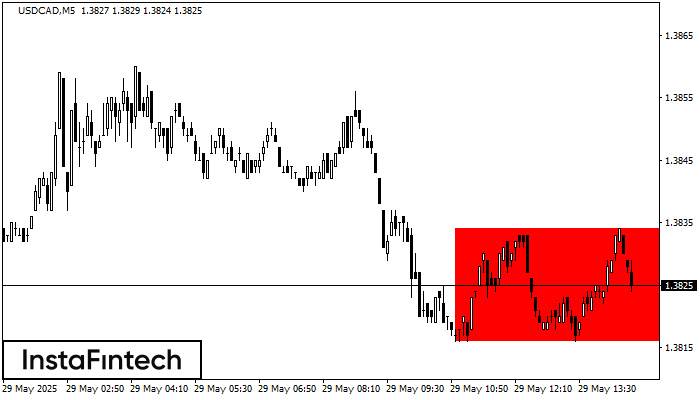
По торговому инструменту USDCAD на M5 сформировалась фигура продолжения тренда - «Прямоугольник». Фигура имеет границы: Нижняя 1.3816; Верхняя 1.3834. В случае пробоя нижней границы вероятно дальнейшее движение в сторону тренда
Таймфреймы М5 и М15 могут иметь больше ложных точек входа.
Открыть график инструмента в новом окне
Двойная вершина
сформирован 29.05 в 13:09:57 (UTC+0)
сила сигнала 1 из 5
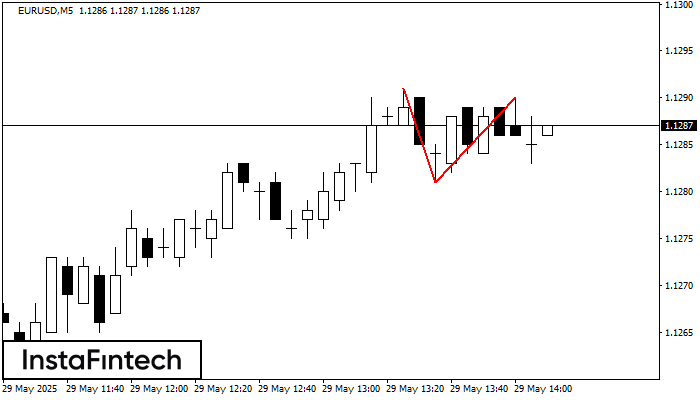
По EURUSD на M5 сформировалась разворотная фигура «Двойная вершина». Характеристика: Верхняя граница 1.1291; Нижняя граница 1.1281; Ширина фигуры 9 пунктов. Позицию на продажу возможно открыть ниже нижней границы 1.1281
Таймфреймы М5 и М15 могут иметь больше ложных точек входа.
Открыть график инструмента в новом окне
Двойное дно
сформирован 29.05 в 12:59:54 (UTC+0)
сила сигнала 2 из 5
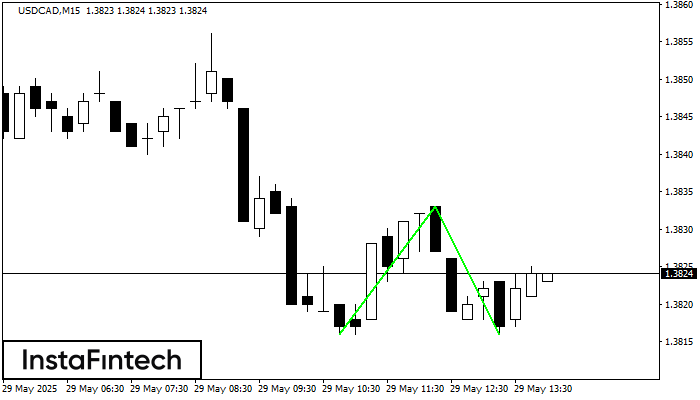
Сформирована фигура «Двойное дно» на графике USDCAD M15. Данное формирование сигнализирует об изменении тенденции с нисходящего на восходящее движение. Сигнал: Торговую позицию на покупку следует открывать после пробоя верхней границы
Таймфреймы М5 и М15 могут иметь больше ложных точек входа.
Открыть график инструмента в новом окне


