

Долзарб паттернлар

Двойная вершина
сформирован 14.04 в 19:00:31 (UTC+0)
сила сигнала 1 из 5
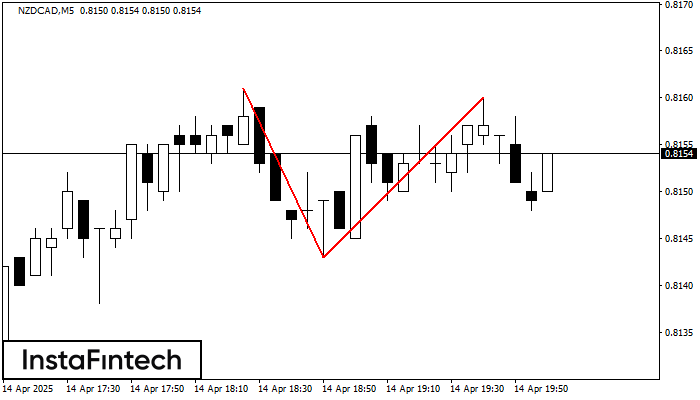
По NZDCAD на M5 сформировалась разворотная фигура «Двойная вершина». Характеристика: Верхняя граница 0.8161; Нижняя граница 0.8143; Ширина фигуры 17 пунктов. Позицию на продажу возможно открыть ниже нижней границы 0.8143, с перспективой хода к уровню 0.8128.
Таймфреймы М5 и М15 могут иметь больше ложных точек входа.
- Все
- Все
- Bearish Rectangle
- Bearish Symmetrical Triangle
- Bearish Symmetrical Triangle
- Bullish Rectangle
- Double Top
- Double Top
- Triple Bottom
- Triple Bottom
- Triple Top
- Triple Top
- Все
- Все
- Покупка
- Продажа
- Все
- 1
- 2
- 3
- 4
- 5
Bearish Rectangle
was formed on 27.05 at 22:51:51 (UTC+0)
signal strength 3 of 5
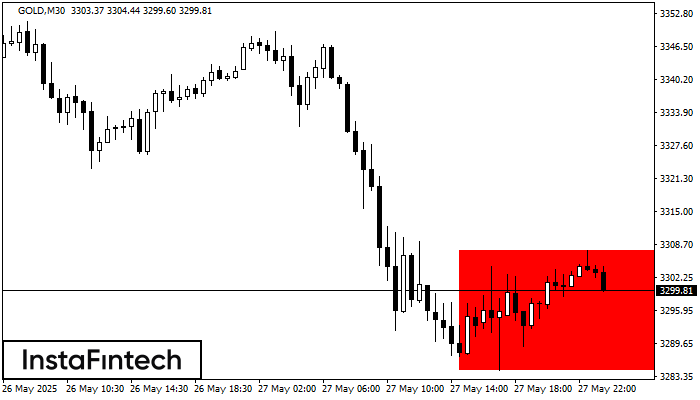
According to the chart of M30, GOLD formed the Bearish Rectangle which is a pattern of a trend continuation. The pattern is contained within the following borders: lower border 3284.62
Open chart in a new window
Double Bottom
was formed on 27.05 at 22:50:17 (UTC+0)
signal strength 1 of 5
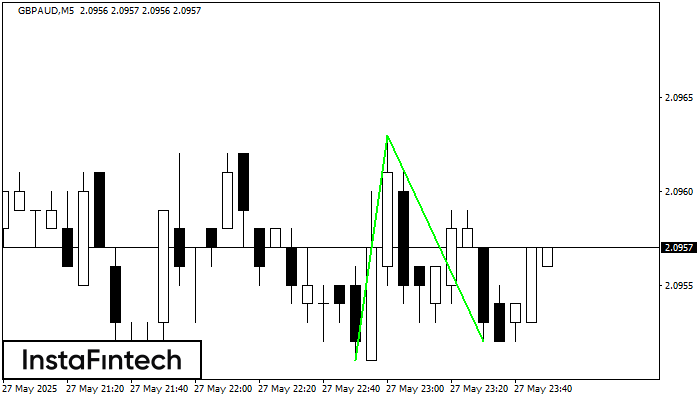
The Double Bottom pattern has been formed on GBPAUD M5; the upper boundary is 2.0963; the lower boundary is 2.0952. The width of the pattern is 12 points. In case
The M5 and M15 time frames may have more false entry points.
Open chart in a new window
Triple Bottom
was formed on 27.05 at 22:10:53 (UTC+0)
signal strength 1 of 5
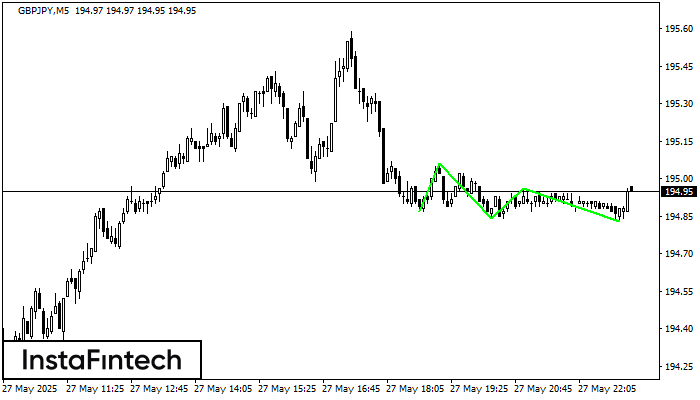
The Triple Bottom pattern has formed on the chart of the GBPJPY M5 trading instrument. The pattern signals a change in the trend from downwards to upwards in the case
The M5 and M15 time frames may have more false entry points.
Open chart in a new window


