

Долзарб паттернлар

Тройная вершина
сформирован 14.04 в 12:50:18 (UTC+0)
сила сигнала 1 из 5
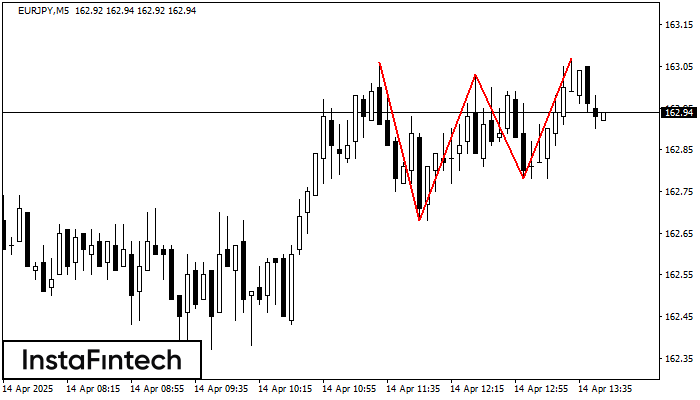
На графике EURJPY M5 образовалась фигура «Тройная вершина», которая сигнализирует об изменении тенденции. Возможный сценарий: После формирования третьей вершины котировка постарается пробить нижнюю границу 162.78, где трейдеру и стоило бы открывать торговую позицию на продажу. Тейк Профит - это и есть проекция ширины фигуры, которая составляет 25 пунктов.
Таймфреймы М5 и М15 могут иметь больше ложных точек входа.
- Все
- Все
- Bearish Rectangle
- Bearish Symmetrical Triangle
- Bearish Symmetrical Triangle
- Bullish Rectangle
- Double Top
- Double Top
- Triple Bottom
- Triple Bottom
- Triple Top
- Triple Top
- Все
- Все
- Покупка
- Продажа
- Все
- 1
- 2
- 3
- 4
- 5
Прямоугольник
сформирован 27.05 в 19:17:50 (UTC+0)
сила сигнала 1 из 5
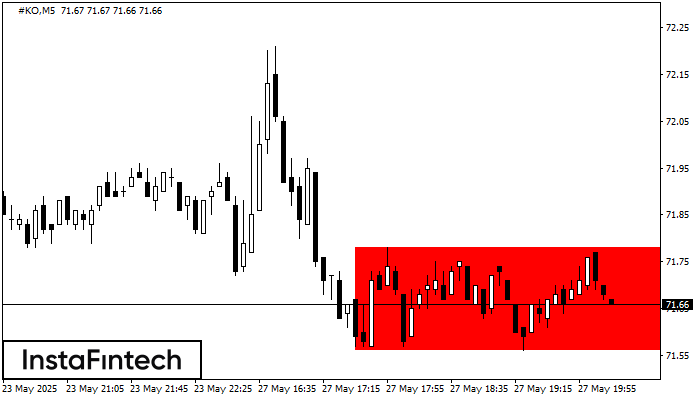
По торговому инструменту #KO на M5 сформировалась фигура продолжения тренда - «Прямоугольник». Фигура имеет границы: Нижняя 71.56; Верхняя 71.78. В случае пробоя нижней границы вероятно дальнейшее движение в сторону тренда
Таймфреймы М5 и М15 могут иметь больше ложных точек входа.
Открыть график инструмента в новом окне
Двойная вершина
сформирован 27.05 в 19:15:18 (UTC+0)
сила сигнала 2 из 5
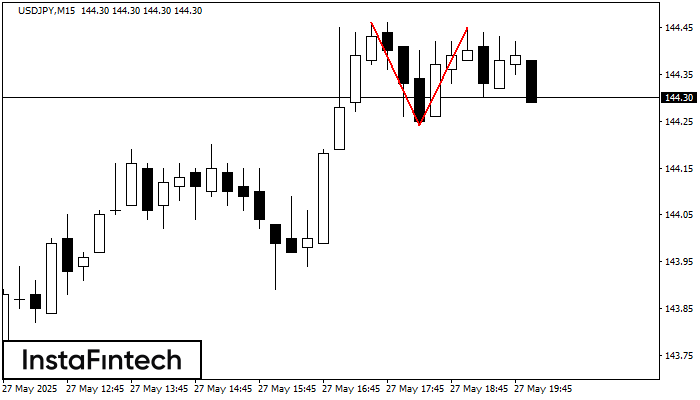
По USDJPY на M15 сформировалась разворотная фигура «Двойная вершина». Характеристика: Верхняя граница 144.46; Нижняя граница 144.24; Ширина фигуры 21 пунктов. Позицию на продажу возможно открыть ниже нижней границы 144.24
Таймфреймы М5 и М15 могут иметь больше ложных точек входа.
Открыть график инструмента в новом окне
Двойная вершина
сформирован 27.05 в 18:55:14 (UTC+0)
сила сигнала 1 из 5
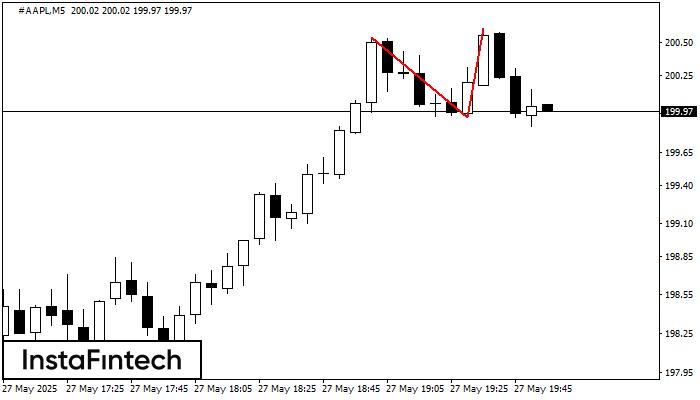
По #AAPL на M5 сформировалась разворотная фигура «Двойная вершина». Характеристика: Верхняя граница 200.54; Нижняя граница 199.92; Ширина фигуры 69 пунктов. Позицию на продажу возможно открыть ниже нижней границы 199.92
Таймфреймы М5 и М15 могут иметь больше ложных точек входа.
Открыть график инструмента в новом окне


