

Долзарб паттернлар

Двойная вершина
сформирован 14.04 в 12:20:34 (UTC+0)
сила сигнала 1 из 5
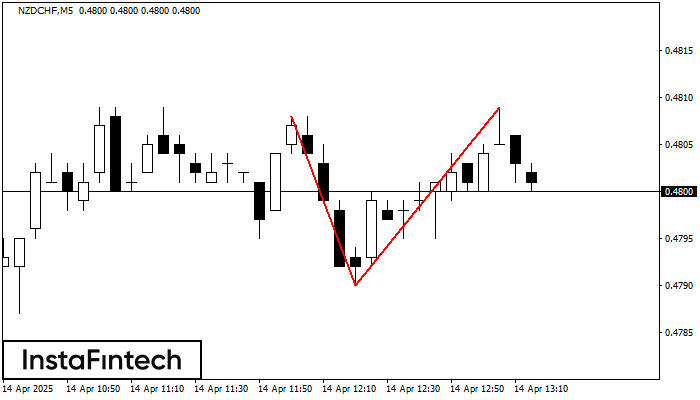
На торговом графике NZDCHF M5 сформировалась разворотная фигура «Двойная вершина». Характеристика: Верхняя граница 0.4809; Нижняя граница 0.4790; Ширина фигуры 19 пунктов. Сигнал: Пробой нижней границы 0.4790 приведет к дальнейшему нисходящему движению с перспективой хода к уровню 0.4775.
Таймфреймы М5 и М15 могут иметь больше ложных точек входа.
- Все
- Все
- Bearish Rectangle
- Bearish Symmetrical Triangle
- Bearish Symmetrical Triangle
- Bullish Rectangle
- Double Top
- Double Top
- Triple Bottom
- Triple Bottom
- Triple Top
- Triple Top
- Все
- Все
- Покупка
- Продажа
- Все
- 1
- 2
- 3
- 4
- 5
Panji Bearish
was formed on 28.05 at 08:12:58 (UTC+0)
signal strength 1 of 5

Pola Panji Bearish telah terbentuk di grafik GBPJPY M5. Pola ini memberikan sinyal potensi kelanjutan tren yang ada. Spesifikasi: titik terendah pola berkoordinat di 194.35; proyeksi titik tertinggi sama dengan
Rangka waktu M5 dan M15 mungkin memiliki lebih dari titik entri yang keliru.
Open chart in a new window
Segitiga Simetris Bullish
was formed on 28.05 at 07:55:36 (UTC+0)
signal strength 1 of 5

Menurut Grafik dari M5, GBPAUD dibentuk pola Segitiga Simetris Bullish, yang menunjukkan tren akan berlanjut. Deksripsi. Batas atas dari pola menyentuh kordinat 2.0988/2.0939 dimana batas yang lebih rendah berada sepanjang
Rangka waktu M5 dan M15 mungkin memiliki lebih dari titik entri yang keliru.
Open chart in a new window
Segitiga Simetris Bearish
was formed on 28.05 at 07:55:12 (UTC+0)
signal strength 1 of 5

Menurut Grafik dari M5, NZDJPY dibentuk pola Segitiga Simetris Bearish. Deskripsi: Batas yang lebih rendah adalah 85.44/85.92 dan batas atas adalah 86.64/85.92. Lebar pola diukur dalam grafik di -120 pips
Rangka waktu M5 dan M15 mungkin memiliki lebih dari titik entri yang keliru.
Open chart in a new window


