

Долзарб паттернлар

Прямоугольник
сформирован 14.04 в 03:32:18 (UTC+0)
сила сигнала 1 из 5
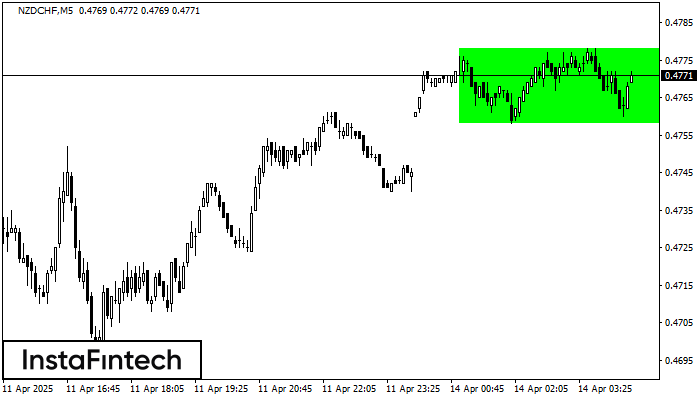
Сформирована фигура «Прямоугольник» на графике NZDCHF M5. Тип фигуры: Продолжение тренда; Границы: Верхняя 0.4778, Нижняя 0.4758; Сигнал: позицию на покупку следует открывать выше верхней границы прямоугольника 0.4778.
Таймфреймы М5 и М15 могут иметь больше ложных точек входа.
- Все
- Все
- Bearish Rectangle
- Bearish Symmetrical Triangle
- Bearish Symmetrical Triangle
- Bullish Rectangle
- Double Top
- Double Top
- Triple Bottom
- Triple Bottom
- Triple Top
- Triple Top
- Все
- Все
- Покупка
- Продажа
- Все
- 1
- 2
- 3
- 4
- 5
Bullish Symmetrical Triangle
was formed on 22.04 at 08:31:06 (UTC+0)
signal strength 1 of 5
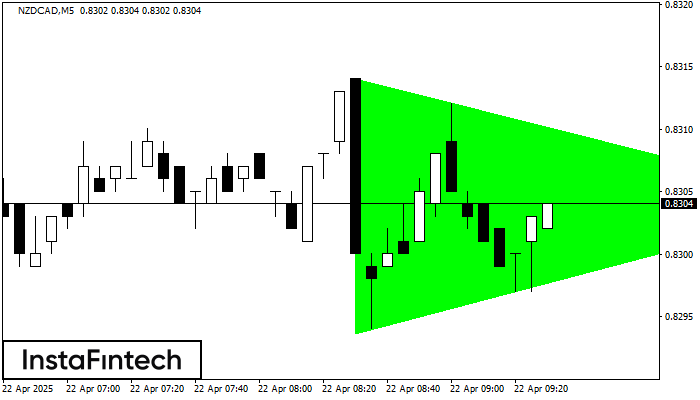
According to the chart of M5, NZDCAD formed the Bullish Symmetrical Triangle pattern, which signals the trend will continue. Description. The upper border of the pattern touches the coordinates 0.8314/0.8304
The M5 and M15 time frames may have more false entry points.
Open chart in a new window
Double Bottom
was formed on 22.04 at 07:00:30 (UTC+0)
signal strength 1 of 5
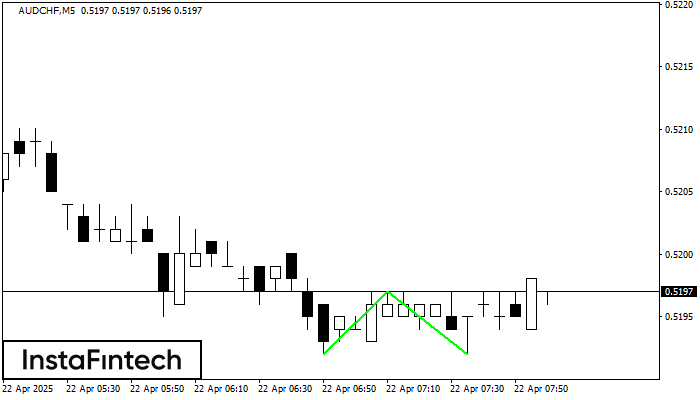
The Double Bottom pattern has been formed on AUDCHF M5; the upper boundary is 0.5197; the lower boundary is 0.5192. The width of the pattern is 5 points. In case
The M5 and M15 time frames may have more false entry points.
Open chart in a new window
Double Top
was formed on 22.04 at 06:46:04 (UTC+0)
signal strength 1 of 5
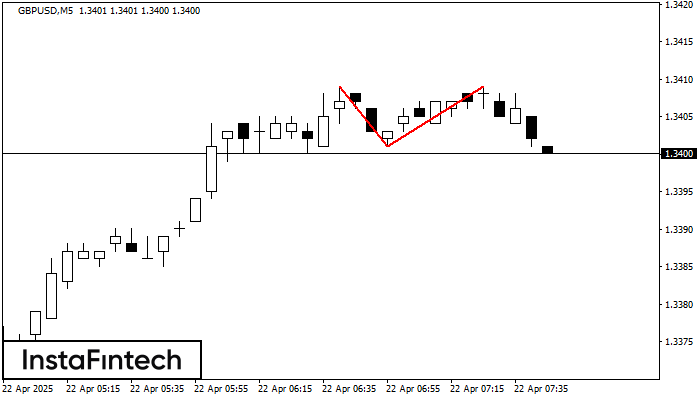
On the chart of GBPUSD M5 the Double Top reversal pattern has been formed. Characteristics: the upper boundary 1.3409; the lower boundary 1.3401; the width of the pattern 8 points
The M5 and M15 time frames may have more false entry points.
Open chart in a new window


