

Долзарб паттернлар

Прямоугольник
сформирован 11.04 в 22:20:31 (UTC+0)
сила сигнала 1 из 5

Сформирована фигура «Прямоугольник» на графике NZDCHF M5. Тип фигуры: Продолжение тренда; Границы: Верхняя 0.4754, Нижняя 0.4746; Сигнал: позицию на покупку следует открывать выше верхней границы прямоугольника 0.4754.
Таймфреймы М5 и М15 могут иметь больше ложных точек входа.
- Все
- Все
- Bearish Rectangle
- Bearish Symmetrical Triangle
- Bearish Symmetrical Triangle
- Bullish Rectangle
- Double Top
- Double Top
- Triple Bottom
- Triple Bottom
- Triple Top
- Triple Top
- Все
- Все
- Покупка
- Продажа
- Все
- 1
- 2
- 3
- 4
- 5
Triple Top
was formed on 28.05 at 20:00:38 (UTC+0)
signal strength 1 of 5
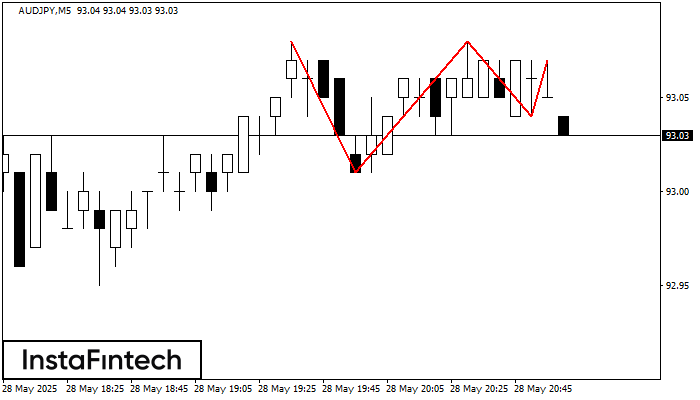
On the chart of the AUDJPY M5 trading instrument, the Triple Top pattern that signals a trend change has formed. It is possible that after formation of the third peak
The M5 and M15 time frames may have more false entry points.
Open chart in a new window
Triple Bottom
was formed on 28.05 at 19:00:32 (UTC+0)
signal strength 1 of 5
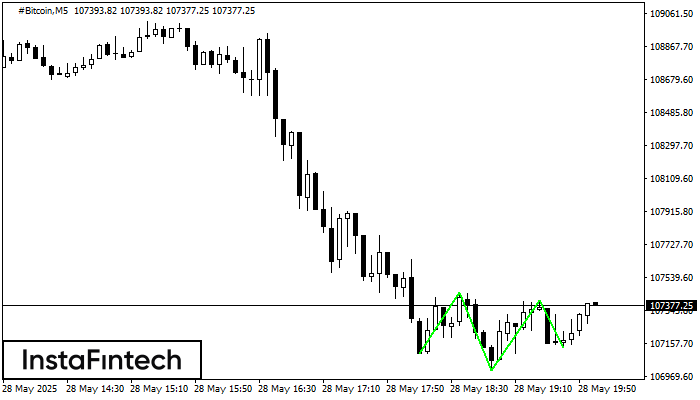
The Triple Bottom pattern has been formed on #Bitcoin M5. It has the following characteristics: resistance level 107451.30/107407.78; support level 107100.45/107133.63; the width is 35085 points. In the event
The M5 and M15 time frames may have more false entry points.
Open chart in a new window
Triple Top
was formed on 28.05 at 18:45:28 (UTC+0)
signal strength 2 of 5
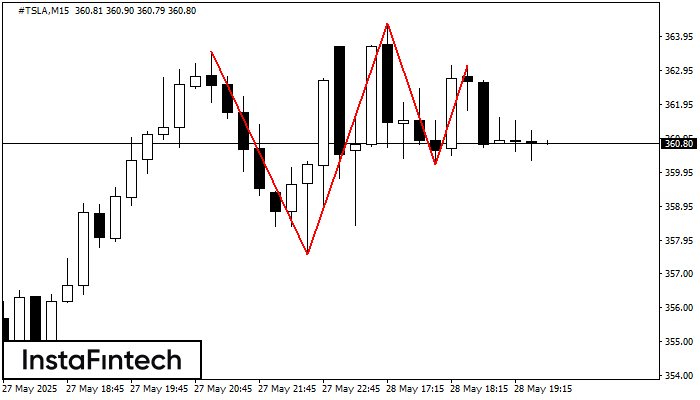
On the chart of the #TSLA M15 trading instrument, the Triple Top pattern that signals a trend change has formed. It is possible that after formation of the third peak
The M5 and M15 time frames may have more false entry points.
Open chart in a new window


