

Долзарб паттернлар

Двойное дно
сформирован 11.04 в 11:59:58 (UTC+0)
сила сигнала 3 из 5
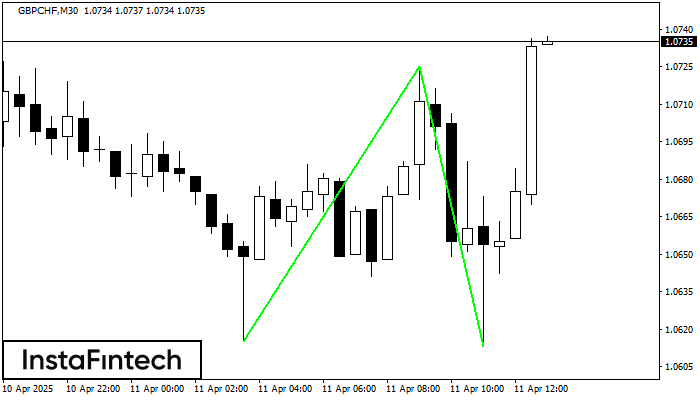
Сформирована фигура «Двойное дно» на графике GBPCHF M30. Верхняя граница 1.0725; Нижняя граница 1.0613; Ширина фигуры 110 пунктов. В случае пробоя верхней границы 1.0725 можно будет прогнозировать изменение тенденции, где ширина фигуры и будет являться расстоянием предположительного Тейк Профита.
- Все
- Все
- Bearish Rectangle
- Bearish Symmetrical Triangle
- Bearish Symmetrical Triangle
- Bullish Rectangle
- Double Top
- Double Top
- Triple Bottom
- Triple Bottom
- Triple Top
- Triple Top
- Все
- Все
- Покупка
- Продажа
- Все
- 1
- 2
- 3
- 4
- 5
ডাবল টপ
was formed on 23.05 at 21:55:30 (UTC+0)
signal strength 1 of 5
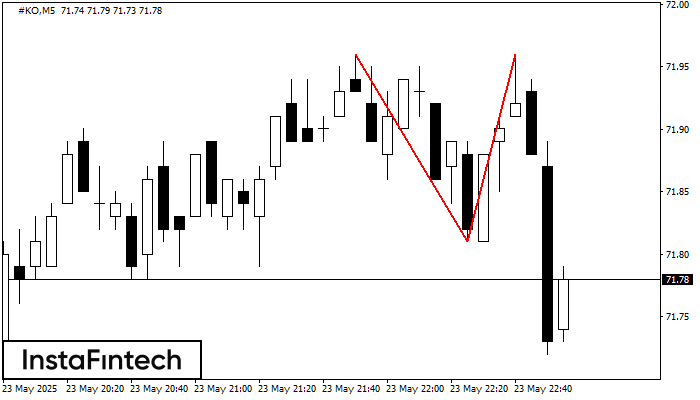
M5 চার্টে, #KO-এর ডাবল টপ রিভার্সাল বা বিপরীতমুখী প্যাটার্ন গঠিত হয়েছে। বৈশিষ্ট্য: উপরের সীমানা 71.96; নীচের সীমানা 71.81; প্যাটার্নের প্রস্থ 15 পয়েন্ট। সংকেত: নীচের সীমানা ব্রেক করা হলে 71.66 স্তরের
M5 এবং M15 টাইম ফ্রেমে আরও ভুল এন্ট্রি পয়েন্ট থাকতে পারে।
Open chart in a new window
ট্রিপল বটম
was formed on 23.05 at 21:55:17 (UTC+0)
signal strength 1 of 5
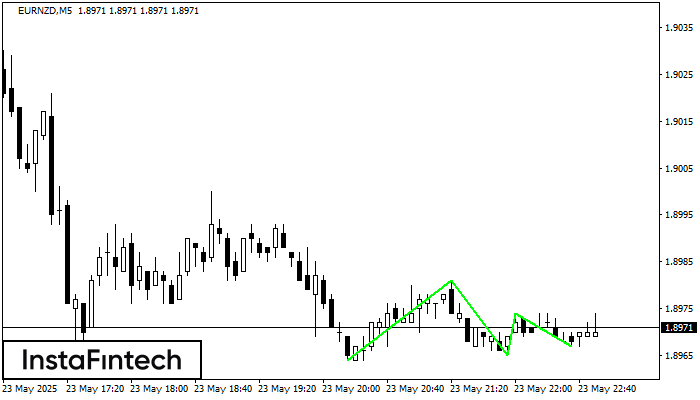
M5 চার্টে, EURNZD ট্রেডিং ইন্সট্রুমেন্টের ট্রিপল বটম প্যাটার্ন গঠিত হয়েছে। 1.8981/1.8974 ব্রেকডাউনের ক্ষেত্রে এই প্যাটার্ন নিম্নমুখী প্রবণতা থেকে ঊর্ধ্বমুখী প্রবণতায় পরিবর্তনের সংকেত দেয়৷
M5 এবং M15 টাইম ফ্রেমে আরও ভুল এন্ট্রি পয়েন্ট থাকতে পারে।
Open chart in a new window
বুলিশ রেক্ট্যাঙ্গেল
was formed on 23.05 at 21:41:57 (UTC+0)
signal strength 1 of 5
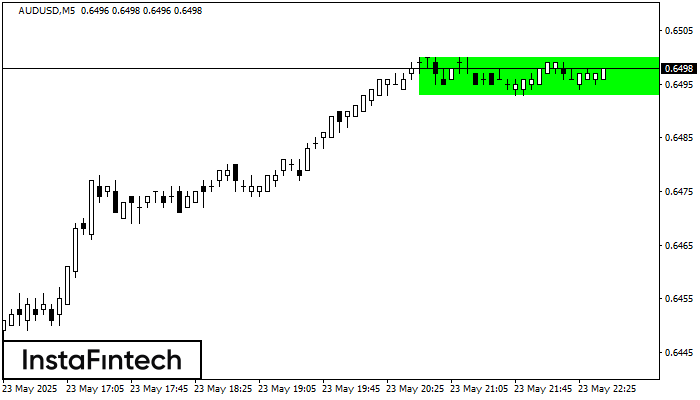
M5 চার্ট অনুযায়ী, AUDUSD বুলিশ রেক্ট্যাঙ্গেল গঠন করেছে। এই প্যাটার্ন চলমান প্রবণতার ধারাবাহিকতা নির্দেশ করে। উপরের সীমানা হল 0.6500, নীচের সীমানা হল 0.6493৷ এই সংকেতের অর্থ হল বুলিশ রেক্ট্যাঙ্গেল -এর
M5 এবং M15 টাইম ফ্রেমে আরও ভুল এন্ট্রি পয়েন্ট থাকতে পারে।
Open chart in a new window


