

Долзарб паттернлар

Двойное дно
сформирован 10.04 в 18:45:24 (UTC+0)
сила сигнала 1 из 5
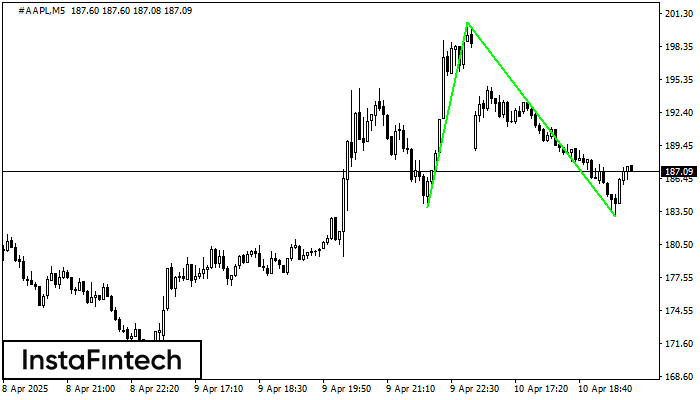
Сформирована фигура «Двойное дно» на графике #AAPL M5. Верхняя граница 200.55; Нижняя граница 183.02; Ширина фигуры 1666 пунктов. В случае пробоя верхней границы 200.55 можно будет прогнозировать изменение тенденции, где ширина фигуры и будет являться расстоянием предположительного Тейк Профита.
Таймфреймы М5 и М15 могут иметь больше ложных точек входа.
- Все
- Все
- Bearish Rectangle
- Bearish Symmetrical Triangle
- Bearish Symmetrical Triangle
- Bullish Rectangle
- Double Top
- Double Top
- Triple Bottom
- Triple Bottom
- Triple Top
- Triple Top
- Все
- Все
- Покупка
- Продажа
- Все
- 1
- 2
- 3
- 4
- 5
Triple Top
was formed on 28.05 at 13:15:43 (UTC+0)
signal strength 2 of 5
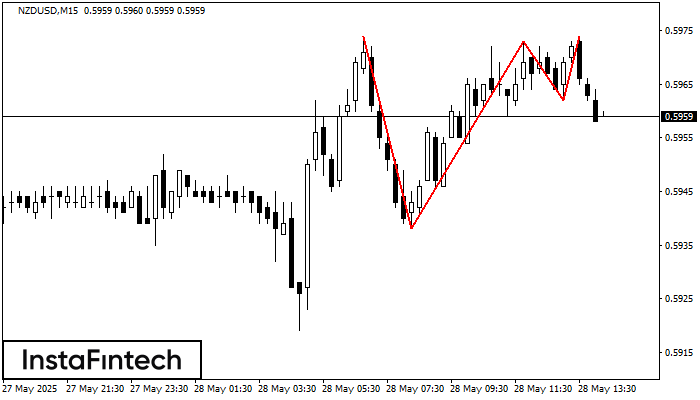
The Triple Top pattern has formed on the chart of the NZDUSD M15. Features of the pattern: borders have an ascending angle; the lower line of the pattern
The M5 and M15 time frames may have more false entry points.
Open chart in a new window
Double Top
was formed on 28.05 at 12:45:36 (UTC+0)
signal strength 2 of 5
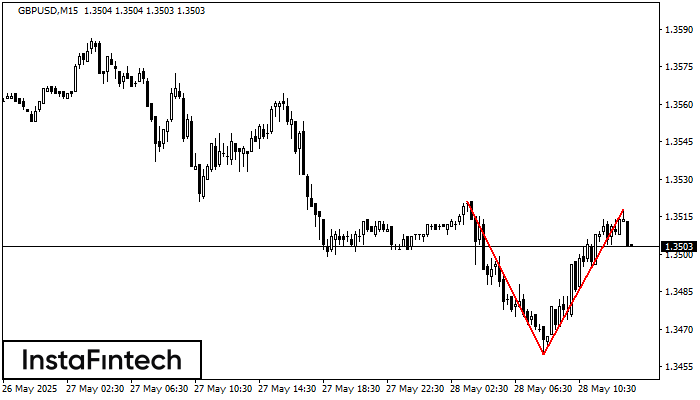
On the chart of GBPUSD M15 the Double Top reversal pattern has been formed. Characteristics: the upper boundary 1.3518; the lower boundary 1.3460; the width of the pattern 58 points
The M5 and M15 time frames may have more false entry points.
Open chart in a new window
Triple Top
was formed on 28.05 at 12:00:34 (UTC+0)
signal strength 2 of 5
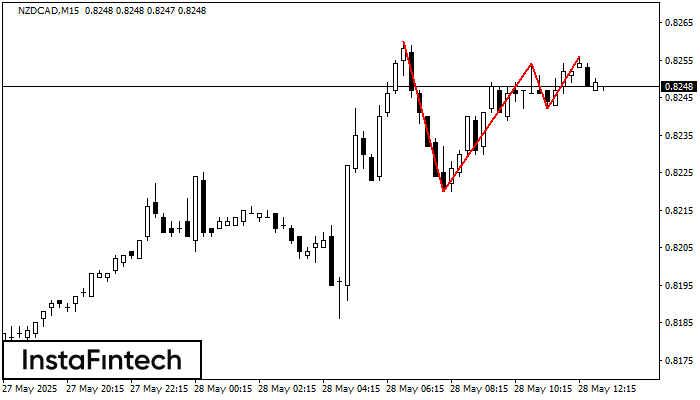
The Triple Top pattern has formed on the chart of the NZDCAD M15 trading instrument. It is a reversal pattern featuring the following characteristics: resistance level 4, support level -22
The M5 and M15 time frames may have more false entry points.
Open chart in a new window


