

Долзарб паттернлар

Двойное дно
сформирован 10.04 в 01:30:34 (UTC+0)
сила сигнала 3 из 5
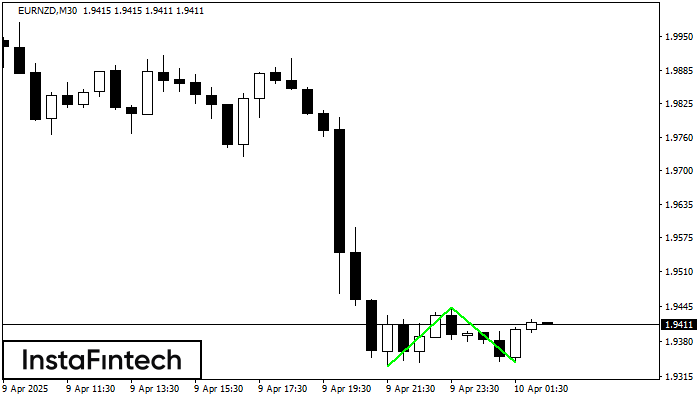
Сформирована фигура «Двойное дно» на графике EURNZD M30. Данное формирование сигнализирует об изменении тенденции с нисходящего на восходящее движение. Сигнал: Торговую позицию на покупку следует открывать после пробоя верхней границы фигуры 1.9443, где перспектива будущего хода будет являться шириной текущей фигуры - 110 пунктов.
- Все
- Все
- Bearish Rectangle
- Bearish Symmetrical Triangle
- Bearish Symmetrical Triangle
- Bullish Rectangle
- Double Top
- Double Top
- Triple Bottom
- Triple Bottom
- Triple Top
- Triple Top
- Все
- Все
- Покупка
- Продажа
- Все
- 1
- 2
- 3
- 4
- 5
Doble Techo
was formed on 23.05 at 15:00:07 (UTC+0)
signal strength 4 of 5
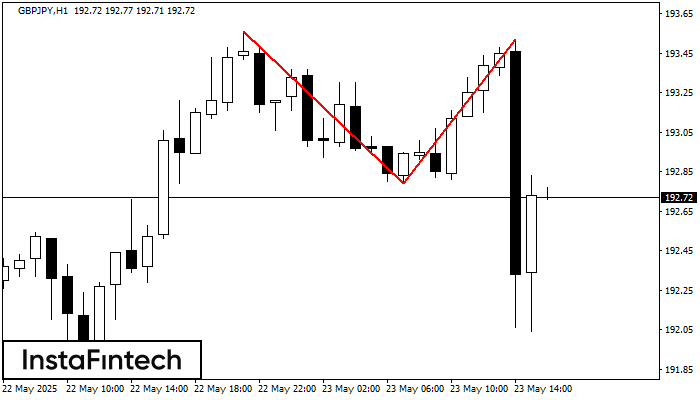
En el gráfico de GBPJPY H1 el patrón de reversión Doble Techo ha sido formado. Características: límite superior 193.52; límite inferior 192.79; el ancho del patrón 73 puntos. La señal
Open chart in a new window
Doble Piso
was formed on 23.05 at 15:00:03 (UTC+0)
signal strength 1 of 5
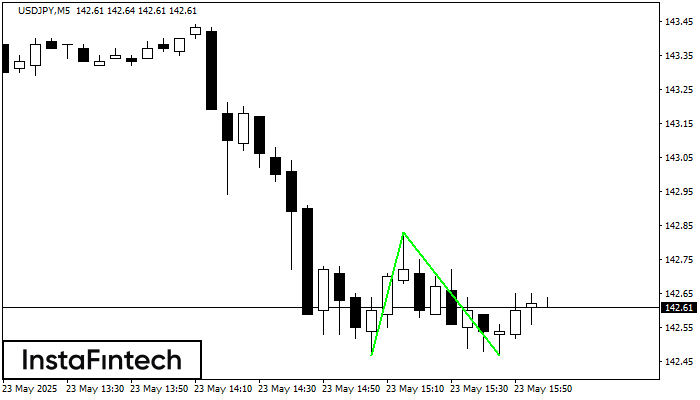
El patrón Doble Piso ha sido formado en USDJPY M5. Características: el nivel de soporte 142.47; el nivel de resistencia 142.83; el ancho del patrón 36 puntos. Si el nivel
Los marcos de tiempo M5 y M15 pueden tener más puntos de entrada falsos.
Open chart in a new window
Doble Techo
was formed on 23.05 at 14:00:05 (UTC+0)
signal strength 3 of 5
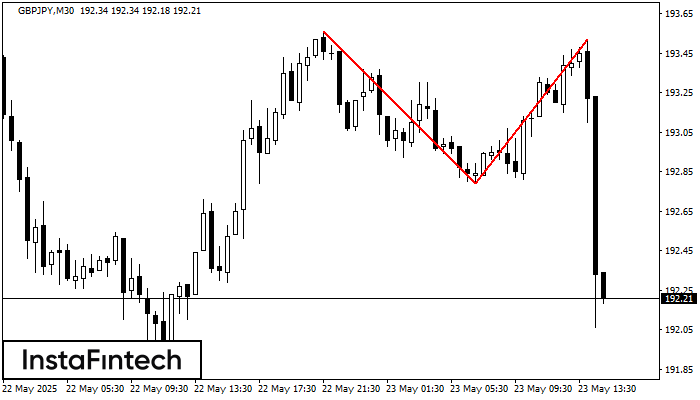
El patrón de reversión Doble Techo ha sido formado en GBPJPY M30. Características: el límite superior 193.56; el límite inferior 192.79; el ancho del patrón es 73 puntos. Es mejor
Open chart in a new window


