

Долзарб паттернлар

Бычий симметричный треугольник
сформирован 09.04 в 23:31:08 (UTC+0)
сила сигнала 1 из 5
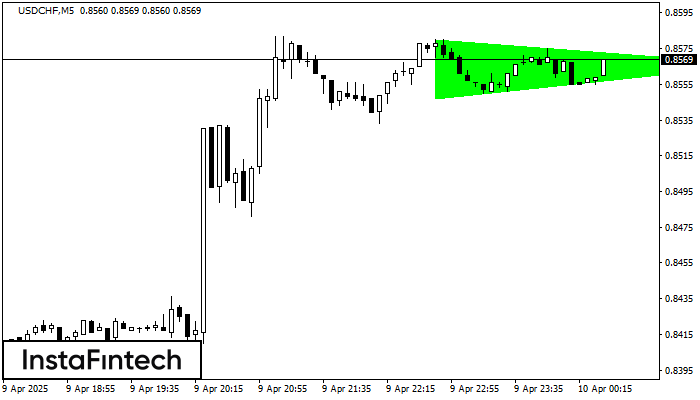
По USDCHF на M5 фигура «Бычий симметричный треугольник». Характеристика: Фигура продолжения тренда; Координаты границ – верхняя 0.8580, нижняя 0.8547. Проекция ширины фигуры 33 пунктов. Прогноз: В случае пробоя верхней границы 0.8580 цена, вероятнее всего, продолжит движение к 0.8581.
Таймфреймы М5 и М15 могут иметь больше ложных точек входа.
- Все
- Все
- Bearish Rectangle
- Bearish Symmetrical Triangle
- Bearish Symmetrical Triangle
- Bullish Rectangle
- Double Top
- Double Top
- Triple Bottom
- Triple Bottom
- Triple Top
- Triple Top
- Все
- Все
- Покупка
- Продажа
- Все
- 1
- 2
- 3
- 4
- 5
ডাবল বটম
was formed on 25.05 at 12:20:13 (UTC+0)
signal strength 1 of 5

M5 চার্টে, #Bitcoin-এর ডাবল বটম প্যাটার্নটি গঠিত হয়েছে। বৈশিষ্ট্য: সাপোর্ট স্তর হচ্ছে 106888.42; রেজিস্ট্যান্স স্তর হচ্ছে 107214.56; প্যাটার্নের প্রস্থ হচ্ছে 32614 পয়েন্ট। রেজিস্ট্যান্স স্তর ভেদ করা হলে, 36370 পয়েন্টের দূরত্বে
M5 এবং M15 টাইম ফ্রেমে আরও ভুল এন্ট্রি পয়েন্ট থাকতে পারে।
Open chart in a new window
বুলিশ রেক্ট্যাঙ্গেল
was formed on 25.05 at 07:55:30 (UTC+0)
signal strength 1 of 5

M5 চার্ট অনুসারে, #Bitcoin বুলিশ রেক্ট্যাঙ্গেল গঠন করেছে যা চলমান প্রবণতার ধারাবাহিকতার প্যাটার্ন। প্যাটার্নটি নিম্নলিখিত সীমানার মধ্যে রয়েছে: নীচের সীমানা 107891.05 – 107891.05 এবং উপরের সীমানা 108246.73 – 108246.73৷ উপরের
M5 এবং M15 টাইম ফ্রেমে আরও ভুল এন্ট্রি পয়েন্ট থাকতে পারে।
Open chart in a new window
বুলিশ সিমেট্রিকাল ট্রায়াঙ্গেল
was formed on 24.05 at 18:46:25 (UTC+0)
signal strength 2 of 5

M15 চার্ট অনুসারে, #Bitcoin বুলিশ সিমেট্রিকাল ট্রায়াঙ্গেল প্যাটার্ন গঠন করেছে, যা চলমান প্রবণতা অব্যাহত থাকবে বলে ইঙ্গিত দিচ্ছে। বর্ণনা: প্যাটার্নের উপরের সীমানা 109440.14/108872.57-এর কোঅর্ডিনেটগুলো স্পর্শ করেছে যেখানে নীচের সীমানা 108311.13/108872.57
M5 এবং M15 টাইম ফ্রেমে আরও ভুল এন্ট্রি পয়েন্ট থাকতে পারে।
Open chart in a new window


