

Долзарб паттернлар

Прямоугольник
сформирован 09.04 в 22:15:27 (UTC+0)
сила сигнала 1 из 5
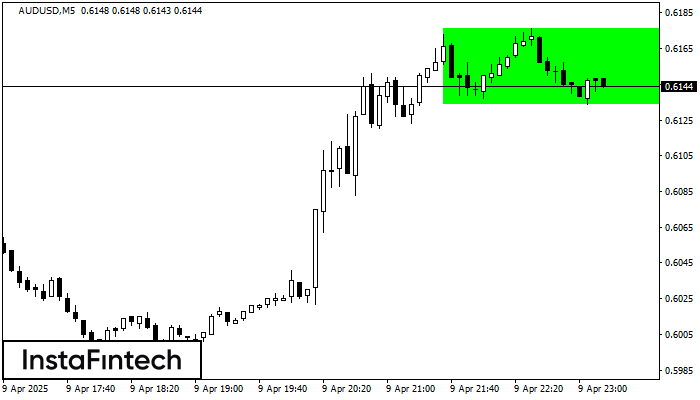
По торговому инструменту AUDUSD на M5 сформировалась фигура продолжения тренда - «Прямоугольник». Фигура имеет границы: Нижняя 0.6134; Верхняя 0.6176. В случае пробоя верхней границы вероятно дальнейшее движение в сторону тренда.
Таймфреймы М5 и М15 могут иметь больше ложных точек входа.
- Все
- Все
- Bearish Rectangle
- Bearish Symmetrical Triangle
- Bearish Symmetrical Triangle
- Bullish Rectangle
- Double Top
- Double Top
- Triple Bottom
- Triple Bottom
- Triple Top
- Triple Top
- Все
- Все
- Покупка
- Продажа
- Все
- 1
- 2
- 3
- 4
- 5
Bearish Symmetrical Triangle
was formed on 22.05 at 19:51:05 (UTC+0)
signal strength 1 of 5
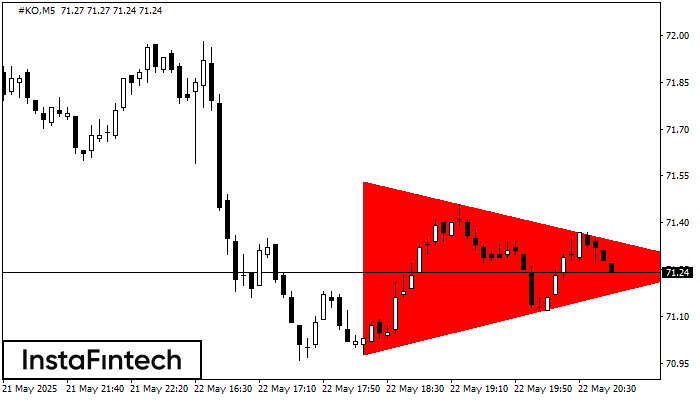
According to the chart of M5, #KO formed the Bearish Symmetrical Triangle pattern. Trading recommendations: A breach of the lower border 70.98 is likely to encourage a continuation
The M5 and M15 time frames may have more false entry points.
Open chart in a new window
Triple Bottom
was formed on 22.05 at 19:45:54 (UTC+0)
signal strength 1 of 5
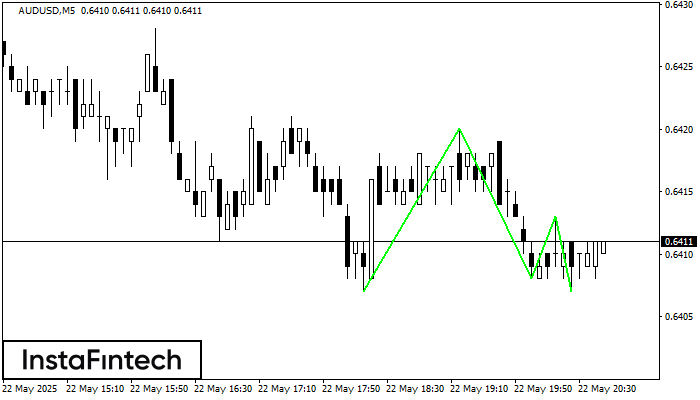
The Triple Bottom pattern has formed on the chart of AUDUSD M5. Features of the pattern: The lower line of the pattern has coordinates 0.6420 with the upper limit 0.6420/0.6413
The M5 and M15 time frames may have more false entry points.
Open chart in a new window
Double Top
was formed on 22.05 at 19:15:10 (UTC+0)
signal strength 1 of 5
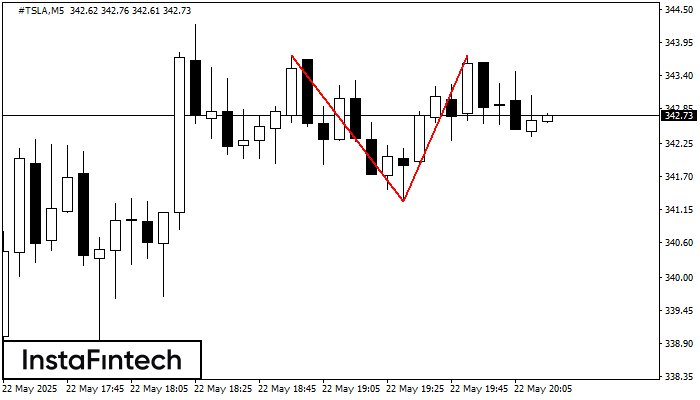
The Double Top reversal pattern has been formed on #TSLA M5. Characteristics: the upper boundary 343.73; the lower boundary 341.29; the width of the pattern is 245 points. Sell trades
The M5 and M15 time frames may have more false entry points.
Open chart in a new window


