

Долзарб паттернлар

Двойная вершина
сформирован 09.04 в 16:45:03 (UTC+0)
сила сигнала 1 из 5
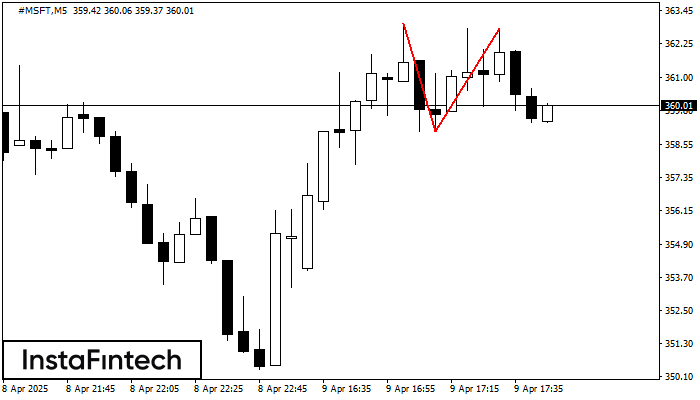
На торговом графике #MSFT M5 сформировалась разворотная фигура «Двойная вершина». Характеристика: Верхняя граница 362.82; Нижняя граница 359.05; Ширина фигуры 377 пунктов. Сигнал: Пробой нижней границы 359.05 приведет к дальнейшему нисходящему движению с перспективой хода к уровню 358.90.
Таймфреймы М5 и М15 могут иметь больше ложных точек входа.
- Все
- Все
- Bearish Rectangle
- Bearish Symmetrical Triangle
- Bearish Symmetrical Triangle
- Bullish Rectangle
- Double Top
- Double Top
- Triple Bottom
- Triple Bottom
- Triple Top
- Triple Top
- Все
- Все
- Покупка
- Продажа
- Все
- 1
- 2
- 3
- 4
- 5
बुलिश सिमेट्रिकल त्रिभुज
was formed on 24.05 at 18:46:25 (UTC+0)
signal strength 2 of 5

M15 के चार्ट के अनुसार, #Bitcoin से बुलिश सिमेट्रिकल त्रिभुज पैटर्न बना, जो दर्शाता है कि ट्रेंड जारी रहेगा। विवरण: पैटर्न की ऊपरी सीमा निर्देशांक 109440.14/108872.57 को स्पर्श करती है
M5 और M15 समय सीमा में अधिक फाल्स एंट्री पॉइंट्स हो सकते हैं।
Open chart in a new window
बियरिश आयत
was formed on 23.05 at 23:00:20 (UTC+0)
signal strength 1 of 5

M5 के चार्ट के अनुसार, EURNZD से बियरिश आयत बना। पैटर्न प्रवृत्ति निरंतरता को इंगित करता है। ऊपरी सीमा 1.8982 है, निचली सीमा 1.8964 है। सिग्नल का मतलब है कि
M5 और M15 समय सीमा में अधिक फाल्स एंट्री पॉइंट्स हो सकते हैं।
Open chart in a new window
बुलिश सिमेट्रिकल त्रिभुज
was formed on 23.05 at 22:14:53 (UTC+0)
signal strength 1 of 5

M5 के चार्ट के अनुसार, AUDCHF से बुलिश सिमेट्रिकल त्रिभुज पैटर्न बना। विवरण: यह एक ट्रेंड जारी रहने का पैटर्न है। 0.5335 और 0.5329 क्रमशः ऊपरी और निचली सीमाओं के
M5 और M15 समय सीमा में अधिक फाल्स एंट्री पॉइंट्स हो सकते हैं।
Open chart in a new window


