

Долзарб паттернлар

Тройная вершина
сформирован 09.04 в 11:34:58 (UTC+0)
сила сигнала 1 из 5

На графике NZDUSD M5 образовалась фигура «Тройная вершина». Данная фигура относится к типу разворотных и имеет характеристику: Верхняя граница 0.5558/0.5558; Нижняя граница 0.5542/0.5546; Ширина фигуры 13 пунктов. Прогноз: В случае пробоя нижней границы 0.5542 вероятно дальнейшее нисходящее движение к уровню 0.5544.
Таймфреймы М5 и М15 могут иметь больше ложных точек входа.
- Все
- Все
- Bearish Rectangle
- Bearish Symmetrical Triangle
- Bearish Symmetrical Triangle
- Bullish Rectangle
- Double Top
- Double Top
- Triple Bottom
- Triple Bottom
- Triple Top
- Triple Top
- Все
- Все
- Покупка
- Продажа
- Все
- 1
- 2
- 3
- 4
- 5
Bullish Rectangle
was formed on 23.05 at 21:41:57 (UTC+0)
signal strength 1 of 5
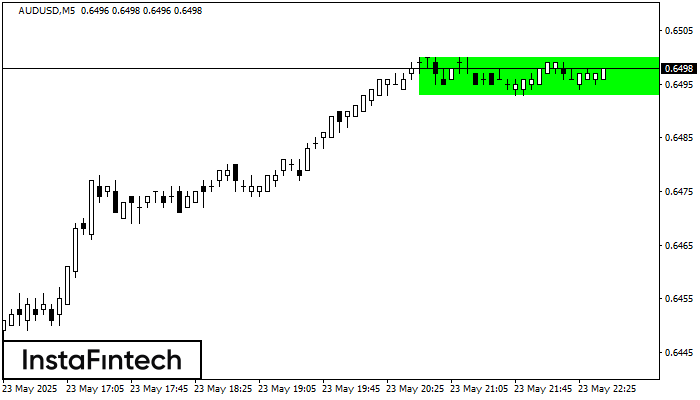
According to the chart of M5, AUDUSD formed the Bullish Rectangle. The pattern indicates a trend continuation. The upper border is 0.6500, the lower border is 0.6493. The signal means
The M5 and M15 time frames may have more false entry points.
Open chart in a new window
Bullish Rectangle
was formed on 23.05 at 21:05:12 (UTC+0)
signal strength 1 of 5
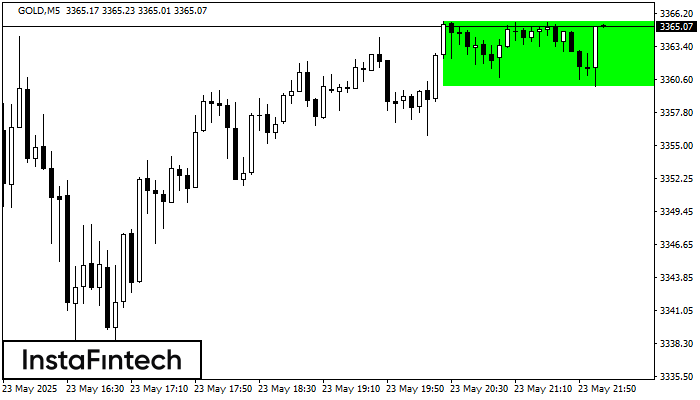
According to the chart of M5, GOLD formed the Bullish Rectangle which is a pattern of a trend continuation. The pattern is contained within the following borders: the lower border
The M5 and M15 time frames may have more false entry points.
Open chart in a new window
Triple Bottom
was formed on 23.05 at 21:00:18 (UTC+0)
signal strength 1 of 5
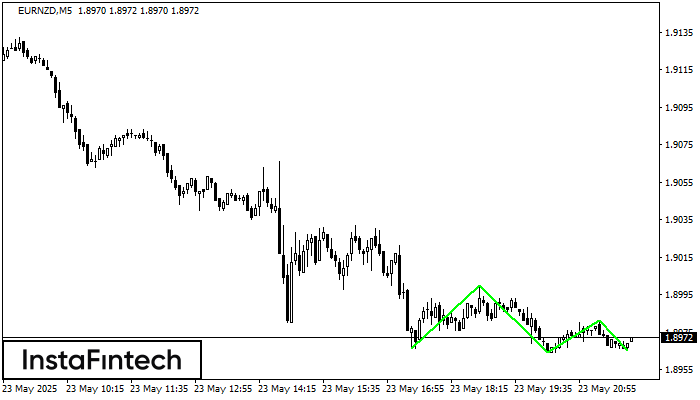
The Triple Bottom pattern has formed on the chart of EURNZD M5. Features of the pattern: The lower line of the pattern has coordinates 1.9000 with the upper limit 1.9000/1.8981
The M5 and M15 time frames may have more false entry points.
Open chart in a new window


