

Долзарб паттернлар

Двойное дно
сформирован 09.04 в 05:25:03 (UTC+0)
сила сигнала 1 из 5
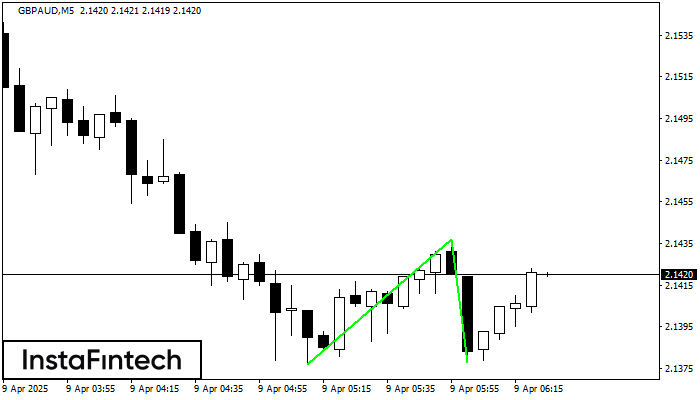
Сформирована фигура «Двойное дно» на графике GBPAUD M5. Данное формирование сигнализирует об изменении тенденции с нисходящего на восходящее движение. Сигнал: Торговую позицию на покупку следует открывать после пробоя верхней границы фигуры 2.1437, где перспектива будущего хода будет являться шириной текущей фигуры - 60 пунктов.
Таймфреймы М5 и М15 могут иметь больше ложных точек входа.
- Все
- Все
- Bearish Rectangle
- Bearish Symmetrical Triangle
- Bearish Symmetrical Triangle
- Bullish Rectangle
- Double Top
- Double Top
- Triple Bottom
- Triple Bottom
- Triple Top
- Triple Top
- Все
- Все
- Покупка
- Продажа
- Все
- 1
- 2
- 3
- 4
- 5
Bearish Symmetrical Triangle
was formed on 23.05 at 18:00:36 (UTC+0)
signal strength 1 of 5
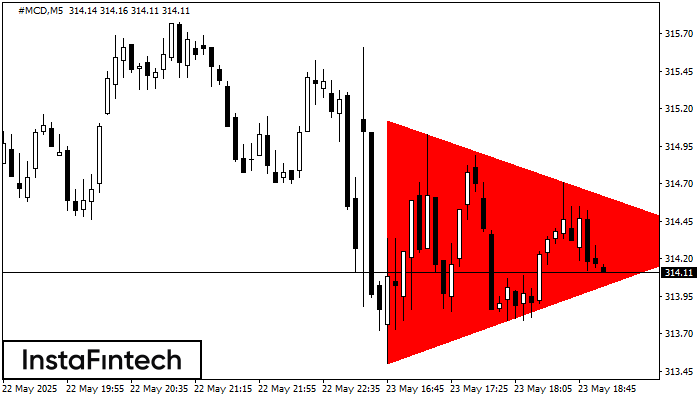
According to the chart of M5, #MCD formed the Bearish Symmetrical Triangle pattern. Description: The lower border is 313.50/314.32 and upper border is 315.12/314.32. The pattern width is measured
The M5 and M15 time frames may have more false entry points.
Open chart in a new window
Bearish pennant
was formed on 23.05 at 17:26:20 (UTC+0)
signal strength 2 of 5
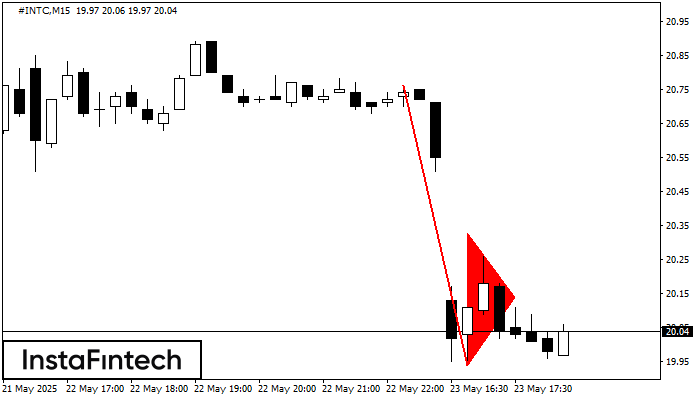
The Bearish pennant pattern has formed on the #INTC M15 chart. It signals potential continuation of the existing trend. Specifications: the pattern’s bottom has the coordinate of 19.94; the projection
The M5 and M15 time frames may have more false entry points.
Open chart in a new window
Bullish pennant
was formed on 23.05 at 17:22:27 (UTC+0)
signal strength 2 of 5
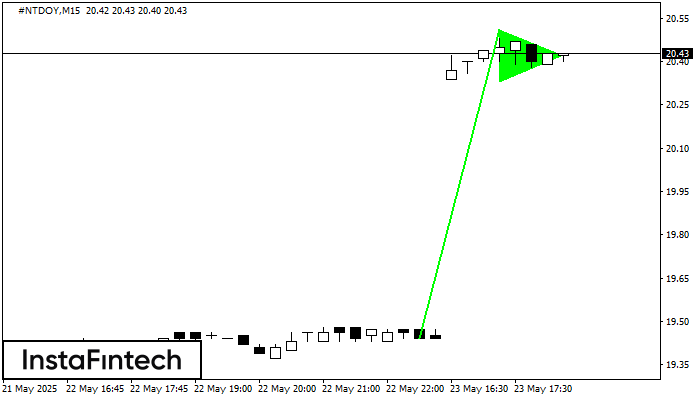
The Bullish pennant graphic pattern has formed on the #NTDOY M15 instrument. This pattern type falls under the category of continuation patterns. In this case, if the quote can breaks
The M5 and M15 time frames may have more false entry points.
Open chart in a new window


