

Долзарб паттернлар

Тройное дно
сформирован 09.04 в 04:00:01 (UTC+0)
сила сигнала 4 из 5

По торговому инструменту NZDUSD на H1 была сформирована графическая фигура «Тройное дно» с характеристиками: Уровень сопротивления 0.5621; Уровень поддержки 0.5481; Ширина 140 пунктов. В случае пробоя уровня сопротивления 0.5638 котировка, скорее всего, продолжит восходящее движение как минимум на 137 пунктов.
- Все
- Все
- Bearish Rectangle
- Bearish Symmetrical Triangle
- Bearish Symmetrical Triangle
- Bullish Rectangle
- Double Top
- Double Top
- Triple Bottom
- Triple Bottom
- Triple Top
- Triple Top
- Все
- Все
- Покупка
- Продажа
- Все
- 1
- 2
- 3
- 4
- 5
Двойная вершина
сформирован 22.05 в 23:00:29 (UTC+0)
сила сигнала 4 из 5
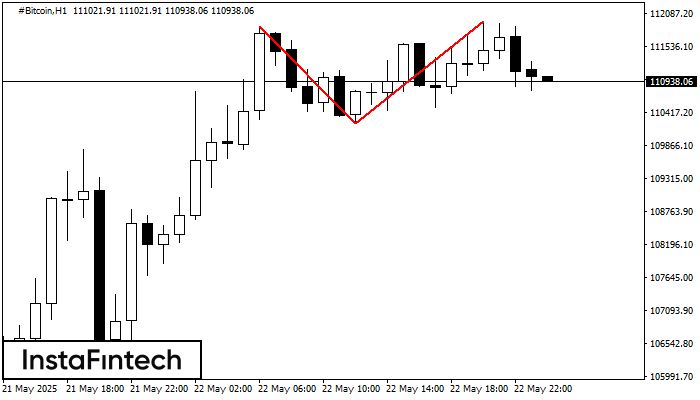
На торговом графике #Bitcoin H1 сформировалась разворотная фигура «Двойная вершина». Характеристика: Верхняя граница 111951.72; Нижняя граница 110239.46; Ширина фигуры 171226 пунктов. Сигнал: Пробой нижней границы 110239.46 приведет к дальнейшему нисходящему
Открыть график инструмента в новом окне
Медвежий симметричный треугольник
сформирован 22.05 в 22:01:48 (UTC+0)
сила сигнала 3 из 5
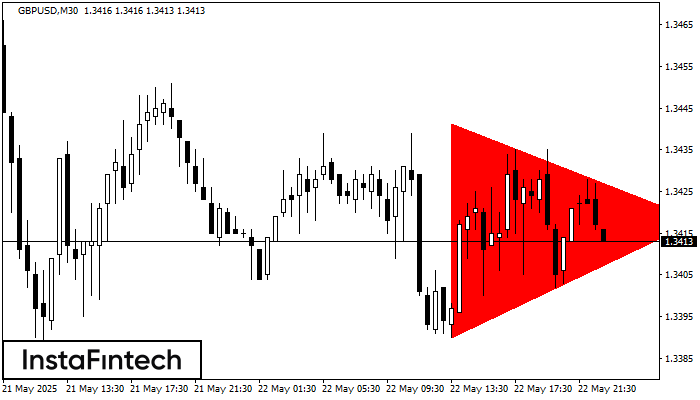
По GBPUSD M30 сформировалась фигура «Медвежий симметричный треугольник». Данная фигура сигнализирует нам о продолжении нисходящего тренда в случае пробоя нижней границы 1.3390, где вероятная прибыль будет являться шириной текущей фигуры
Открыть график инструмента в новом окне
Медвежий симметричный треугольник
сформирован 22.05 в 22:01:15 (UTC+0)
сила сигнала 2 из 5
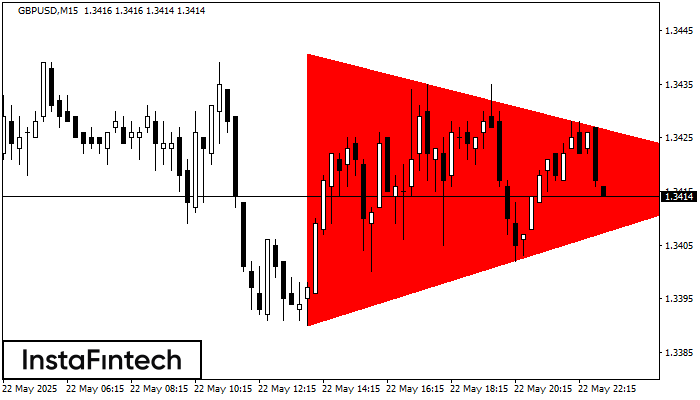
По GBPUSD M15 сформировалась фигура «Медвежий симметричный треугольник». Данная фигура сигнализирует нам о продолжении нисходящего тренда в случае пробоя нижней границы 1.3390, где вероятная прибыль будет являться шириной текущей фигуры
Таймфреймы М5 и М15 могут иметь больше ложных точек входа.
Открыть график инструмента в новом окне


