

Долзарб паттернлар

Двойное дно
сформирован 08.04 в 11:50:07 (UTC+0)
сила сигнала 1 из 5
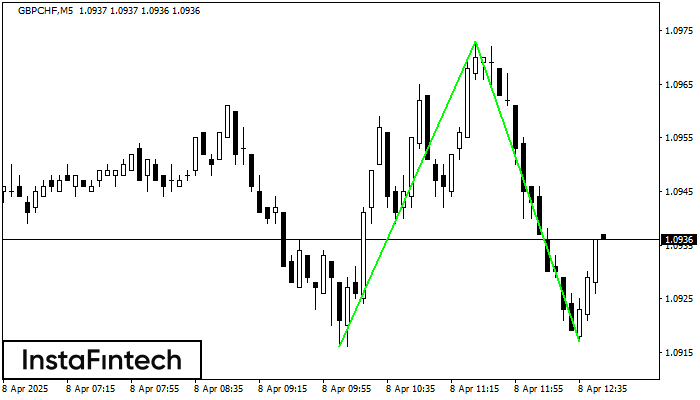
Сформирована фигура «Двойное дно» на графике GBPCHF M5. Характеристика: Уровень поддержки 1.0916; Уровень сопротивления 1.0973; Ширина фигуры 57 пунктов. В случае пробоя уровня сопротивления можно будет прогнозировать изменение тенденции, где первая точка фиксации прибыли находится на расстоянии 56 пунктов.
Таймфреймы М5 и М15 могут иметь больше ложных точек входа.
Шунингдек кўринг
- Все
- Все
- Bearish Rectangle
- Bearish Symmetrical Triangle
- Bearish Symmetrical Triangle
- Bullish Rectangle
- Double Top
- Double Top
- Triple Bottom
- Triple Bottom
- Triple Top
- Triple Top
- Все
- Все
- Покупка
- Продажа
- Все
- 1
- 2
- 3
- 4
- 5
Bullish Flag
was formed on 23.05 at 18:36:49 (UTC+0)
signal strength 1 of 5
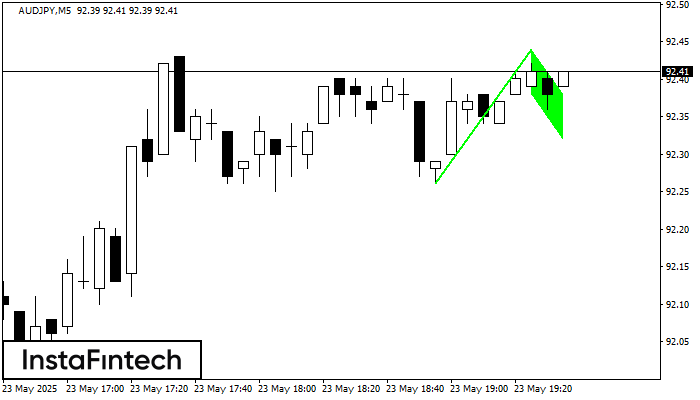
The Bullish Flag pattern has been formed on AUDJPY at M5. The lower boundary of the pattern is located at 92.38/92.32, while the higher boundary lies at 92.44/92.38. The projection
The M5 and M15 time frames may have more false entry points.
Open chart in a new window
Bullish pennant
was formed on 23.05 at 18:36:43 (UTC+0)
signal strength 1 of 5
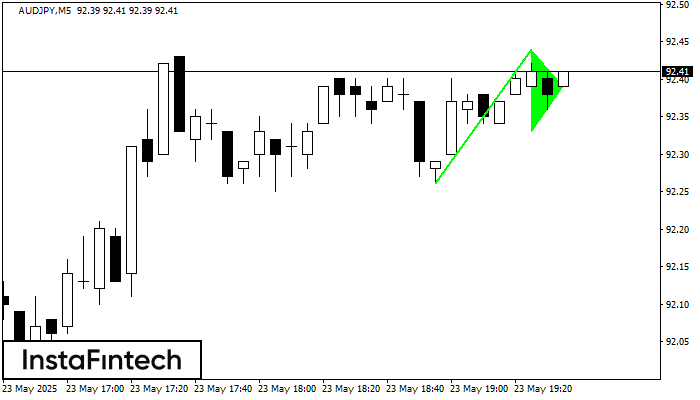
The Bullish pennant pattern is formed on the AUDJPY M5 chart. It is a type of the continuation pattern. Supposedly, in case the price is fixed above the pennant’s high
The M5 and M15 time frames may have more false entry points.
Open chart in a new window
Triple Top
was formed on 23.05 at 18:36:14 (UTC+0)
signal strength 1 of 5
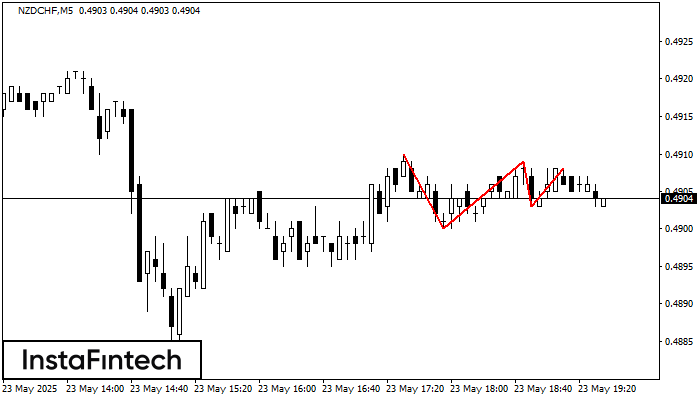
The Triple Top pattern has formed on the chart of the NZDCHF M5. Features of the pattern: borders have an ascending angle; the lower line of the pattern
The M5 and M15 time frames may have more false entry points.
Open chart in a new window


