

Долзарб паттернлар

Медвежий вымпел
сформирован 07.04 в 16:04:58 (UTC+0)
сила сигнала 1 из 5
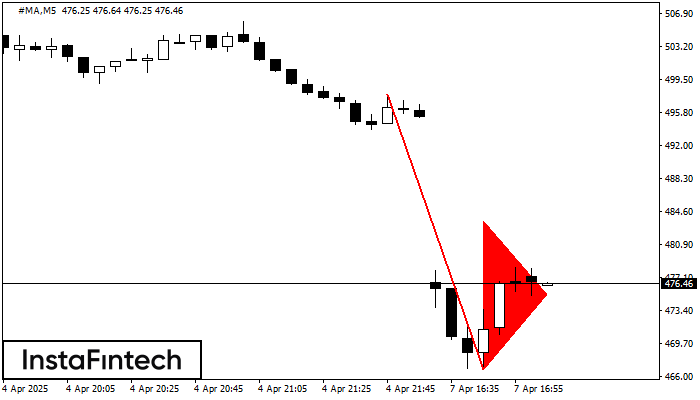
На графике #MA M5 сформировалась фигура «Медвежий вымпел», которая сигнализирует о возможном продолжении тренда. Характеристика: основание фигуры имеет координаты 466.76; проекция высоты флагштока равна 3098 пунктов. В случае если цена преодолеет основание фигуры 466.76, то ожидается продолжение нисходящего тренда на уровень 466.61 пунктов.
Таймфреймы М5 и М15 могут иметь больше ложных точек входа.
- Все
- Все
- Bearish Rectangle
- Bearish Symmetrical Triangle
- Bearish Symmetrical Triangle
- Bullish Rectangle
- Double Top
- Double Top
- Triple Bottom
- Triple Bottom
- Triple Top
- Triple Top
- Все
- Все
- Покупка
- Продажа
- Все
- 1
- 2
- 3
- 4
- 5
Bullish Symmetrical Triangle
was formed on 28.05 at 01:18:08 (UTC+0)
signal strength 2 of 5
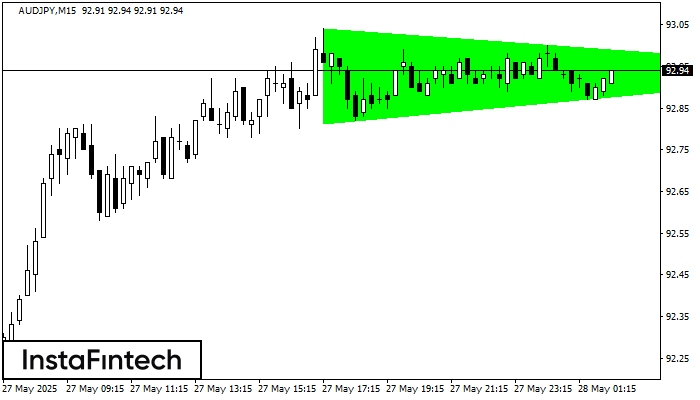
According to the chart of M15, AUDJPY formed the Bullish Symmetrical Triangle pattern. Description: This is the pattern of a trend continuation. 93.04 and 92.81 are the coordinates
The M5 and M15 time frames may have more false entry points.
Open chart in a new window
Bearish Symmetrical Triangle
was formed on 28.05 at 01:06:54 (UTC+0)
signal strength 1 of 5
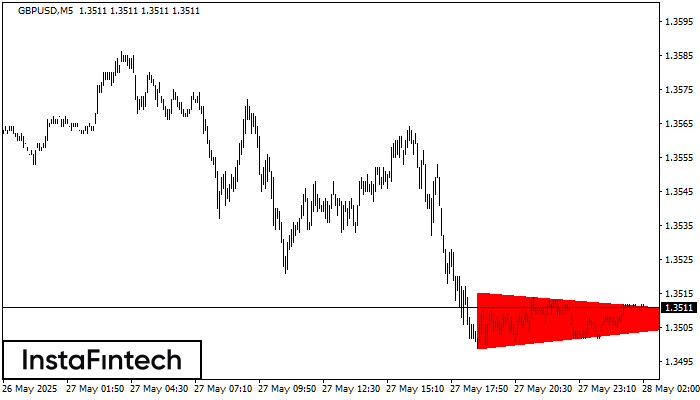
According to the chart of M5, GBPUSD formed the Bearish Symmetrical Triangle pattern. Description: The lower border is 1.3499/1.3508 and upper border is 1.3515/1.3508. The pattern width is measured
The M5 and M15 time frames may have more false entry points.
Open chart in a new window
Double Bottom
was formed on 28.05 at 01:06:08 (UTC+0)
signal strength 1 of 5
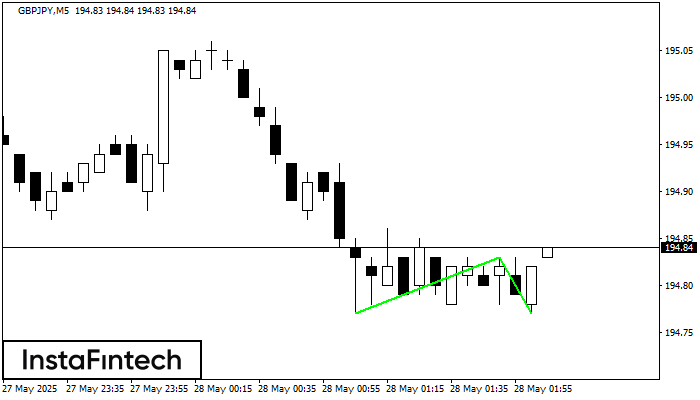
The Double Bottom pattern has been formed on GBPJPY M5. This formation signals a reversal of the trend from downwards to upwards. The signal is that a buy trade should
The M5 and M15 time frames may have more false entry points.
Open chart in a new window


