

Долзарб паттернлар

Прямоугольник
сформирован 07.04 в 13:58:52 (UTC+0)
сила сигнала 1 из 5
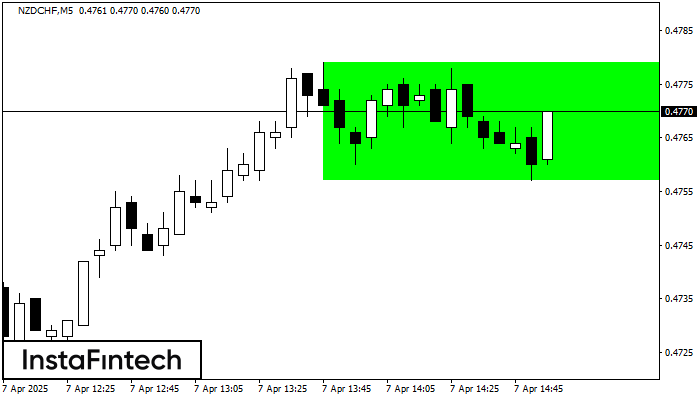
По торговому инструменту NZDCHF на M5 сформировалась фигура продолжения тренда - «Прямоугольник». Фигура имеет границы: Нижняя 0.4757; Верхняя 0.4779. В случае пробоя верхней границы вероятно дальнейшее движение в сторону тренда.
Таймфреймы М5 и М15 могут иметь больше ложных точек входа.
Шунингдек кўринг
- Все
- Все
- Bearish Rectangle
- Bearish Symmetrical Triangle
- Bearish Symmetrical Triangle
- Bullish Rectangle
- Double Top
- Double Top
- Triple Bottom
- Triple Bottom
- Triple Top
- Triple Top
- Все
- Все
- Покупка
- Продажа
- Все
- 1
- 2
- 3
- 4
- 5
Triple Bottom
was formed on 14.04 at 01:00:54 (UTC+0)
signal strength 4 of 5

The Triple Bottom pattern has been formed on USDCHF H1. It has the following characteristics: resistance level 0.8256/0.8192; support level 0.8140/0.8142; the width is 116 points. In the event
Open chart in a new window
Double Top
was formed on 14.04 at 00:45:17 (UTC+0)
signal strength 2 of 5

The Double Top pattern has been formed on AUDCAD M15. It signals that the trend has been changed from upwards to downwards. Probably, if the base of the pattern 0.8713
The M5 and M15 time frames may have more false entry points.
Open chart in a new window
Bullish Rectangle
was formed on 14.04 at 00:42:49 (UTC+0)
signal strength 1 of 5
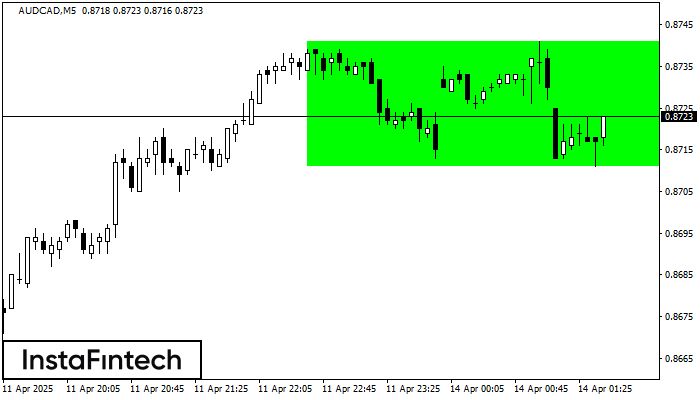
According to the chart of M5, AUDCAD formed the Bullish Rectangle which is a pattern of a trend continuation. The pattern is contained within the following borders: the lower border
The M5 and M15 time frames may have more false entry points.
Open chart in a new window


