

Долзарб паттернлар

Двойная вершина
сформирован 07.04 в 13:39:47 (UTC+0)
сила сигнала 1 из 5
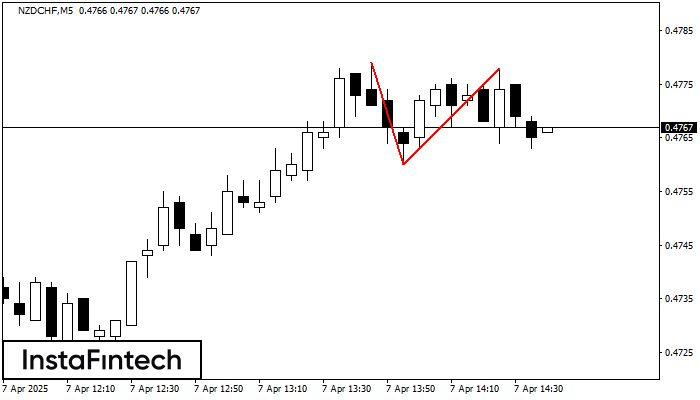
На торговом графике NZDCHF M5 сформировалась разворотная фигура «Двойная вершина». Характеристика: Верхняя граница 0.4778; Нижняя граница 0.4760; Ширина фигуры 18 пунктов. Сигнал: Пробой нижней границы 0.4760 приведет к дальнейшему нисходящему движению с перспективой хода к уровню 0.4745.
Таймфреймы М5 и М15 могут иметь больше ложных точек входа.
- Все
- Все
- Bearish Rectangle
- Bearish Symmetrical Triangle
- Bearish Symmetrical Triangle
- Bullish Rectangle
- Double Top
- Double Top
- Triple Bottom
- Triple Bottom
- Triple Top
- Triple Top
- Все
- Все
- Покупка
- Продажа
- Все
- 1
- 2
- 3
- 4
- 5
Triple Bottom
was formed on 24.04 at 09:15:22 (UTC+0)
signal strength 1 of 5
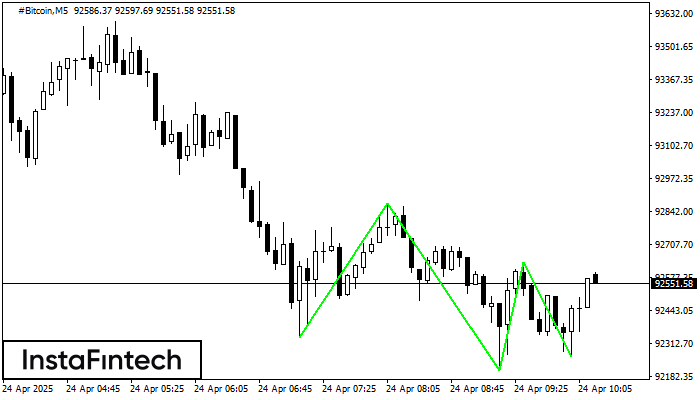
The Triple Bottom pattern has formed on the chart of #Bitcoin M5. Features of the pattern: The lower line of the pattern has coordinates 92871.00 with the upper limit 92871.00/92637.22
The M5 and M15 time frames may have more false entry points.
Open chart in a new window
Double Top
was formed on 24.04 at 09:00:36 (UTC+0)
signal strength 3 of 5
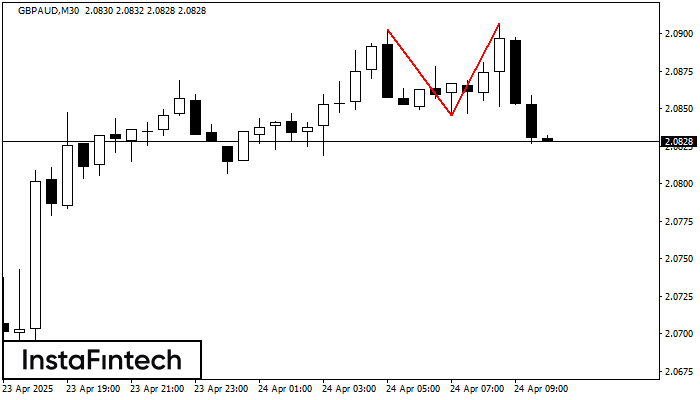
The Double Top pattern has been formed on GBPAUD M30. It signals that the trend has been changed from upwards to downwards. Probably, if the base of the pattern 2.0846
Open chart in a new window
Triple Bottom
was formed on 24.04 at 08:30:33 (UTC+0)
signal strength 3 of 5
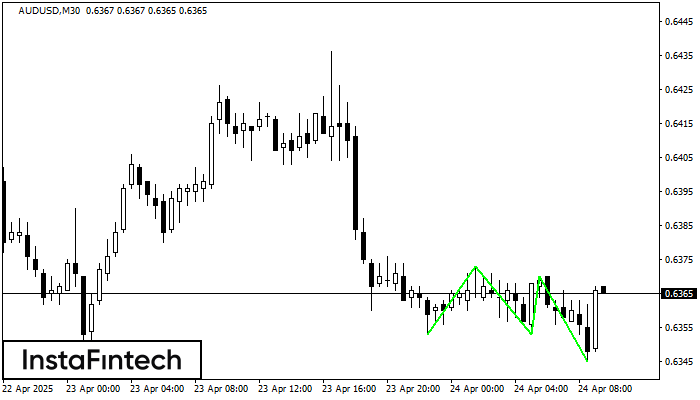
The Triple Bottom pattern has formed on the chart of AUDUSD M30. Features of the pattern: The lower line of the pattern has coordinates 0.6373 with the upper limit 0.6373/0.6370
Open chart in a new window


