

Долзарб паттернлар

Тройная вершина
сформирован 07.04 в 05:50:18 (UTC+0)
сила сигнала 1 из 5
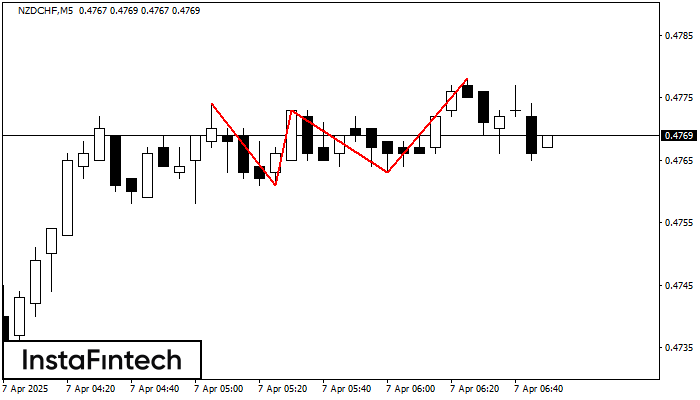
На графике NZDCHF M5 образовалась фигура «Тройная вершина». Данная фигура относится к типу разворотных и имеет характеристику: Верхняя граница 0.4774/0.4778; Нижняя граница 0.4761/0.4763; Ширина фигуры 10 пунктов. Прогноз: В случае пробоя нижней границы 0.4761 вероятно дальнейшее нисходящее движение к уровню 0.4758.
Таймфреймы М5 и М15 могут иметь больше ложных точек входа.
- Все
- Все
- Bearish Rectangle
- Bearish Symmetrical Triangle
- Bearish Symmetrical Triangle
- Bullish Rectangle
- Double Top
- Double Top
- Triple Bottom
- Triple Bottom
- Triple Top
- Triple Top
- Все
- Все
- Покупка
- Продажа
- Все
- 1
- 2
- 3
- 4
- 5
Прямоугольник
сформирован 26.05 в 03:20:39 (UTC+0)
сила сигнала 1 из 5
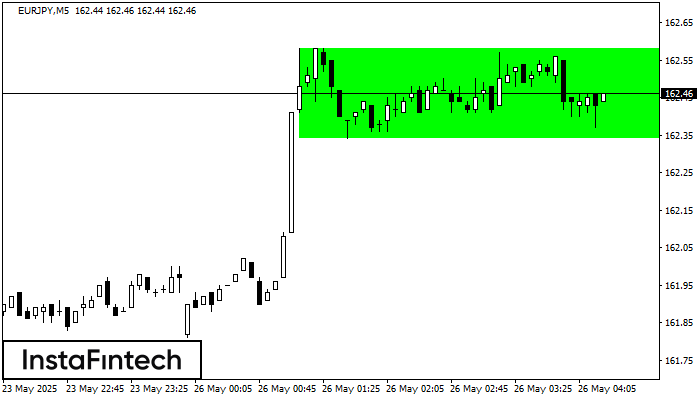
По торговому инструменту EURJPY на M5 сформировалась фигура продолжения тренда - «Прямоугольник». Фигура имеет границы: Нижняя 162.34; Верхняя 162.58. В случае пробоя верхней границы вероятно дальнейшее движение в сторону тренда
Таймфреймы М5 и М15 могут иметь больше ложных точек входа.
Открыть график инструмента в новом окне
Двойное дно
сформирован 26.05 в 03:00:31 (UTC+0)
сила сигнала 4 из 5
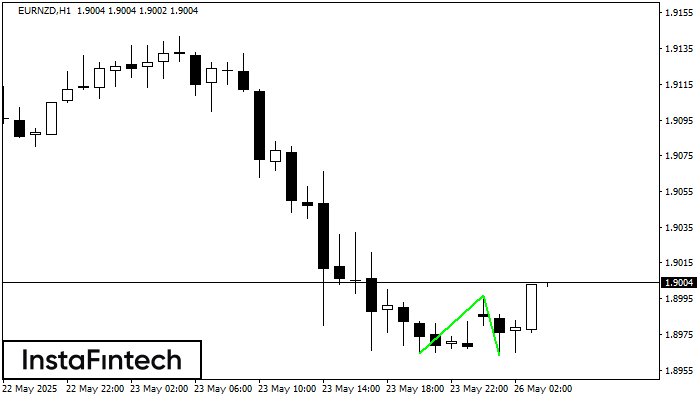
Сформирована фигура «Двойное дно» на графике EURNZD H1. Данное формирование сигнализирует об изменении тенденции с нисходящего на восходящее движение. Сигнал: Торговую позицию на покупку следует открывать после пробоя верхней границы
Открыть график инструмента в новом окне
Двойная вершина
сформирован 26.05 в 03:00:31 (UTC+0)
сила сигнала 1 из 5
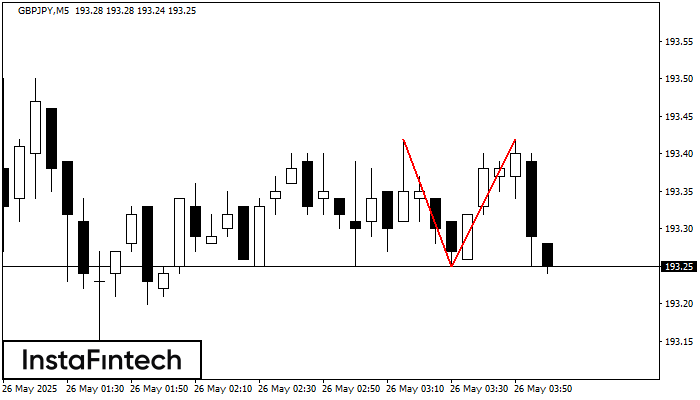
На торговом графике GBPJPY M5 сформировалась разворотная фигура «Двойная вершина». Характеристика: Верхняя граница 193.42; Нижняя граница 193.25; Ширина фигуры 17 пунктов. Сигнал: Пробой нижней границы 193.25 приведет к дальнейшему нисходящему
Таймфреймы М5 и М15 могут иметь больше ложных точек входа.
Открыть график инструмента в новом окне


