

Долзарб паттернлар

Медвежий вымпел
сформирован 07.04 в 04:50:23 (UTC+0)
сила сигнала 1 из 5
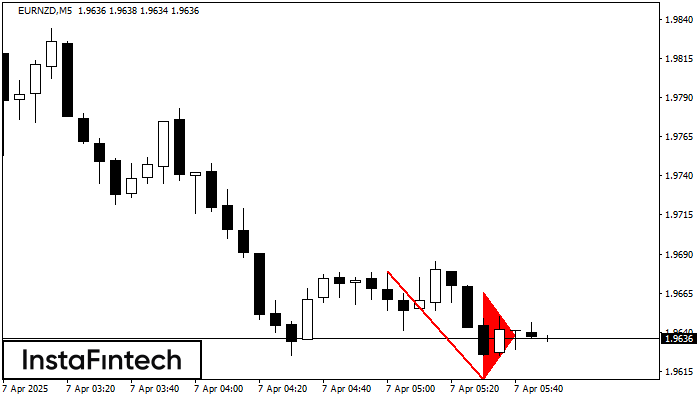
На графике EURNZD M5 сформировалась фигура «Медвежий вымпел». Фигура сигнализирует о продолжении нисходящего тренда в случае пробоя минимума вымпела 1.9609. Рекомендации: Отложенный ордер Sell Stop выставляется на 10 пунктов ниже минимума фигуры. Тейк Профит выставляется на расстояние проекции высоты флагштока.
Таймфреймы М5 и М15 могут иметь больше ложных точек входа.
- Все
- Все
- Bearish Rectangle
- Bearish Symmetrical Triangle
- Bearish Symmetrical Triangle
- Bullish Rectangle
- Double Top
- Double Top
- Triple Bottom
- Triple Bottom
- Triple Top
- Triple Top
- Все
- Все
- Покупка
- Продажа
- Все
- 1
- 2
- 3
- 4
- 5
Double Bottom
was formed on 27.05 at 23:30:20 (UTC+0)
signal strength 1 of 5
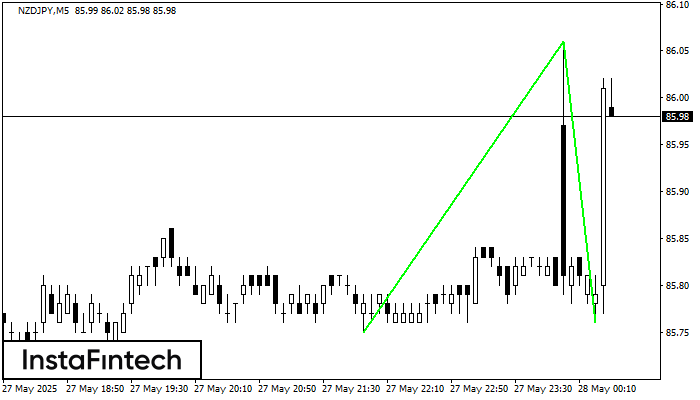
The Double Bottom pattern has been formed on NZDJPY M5. This formation signals a reversal of the trend from downwards to upwards. The signal is that a buy trade should
The M5 and M15 time frames may have more false entry points.
Open chart in a new window
Double Bottom
was formed on 27.05 at 23:30:11 (UTC+0)
signal strength 3 of 5
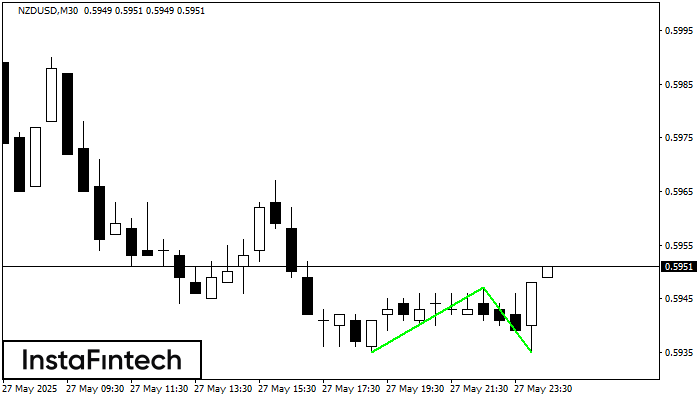
The Double Bottom pattern has been formed on NZDUSD M30; the upper boundary is 0.5947; the lower boundary is 0.5935. The width of the pattern is 12 points. In case
Open chart in a new window
Triple Top
was formed on 27.05 at 23:15:37 (UTC+0)
signal strength 2 of 5
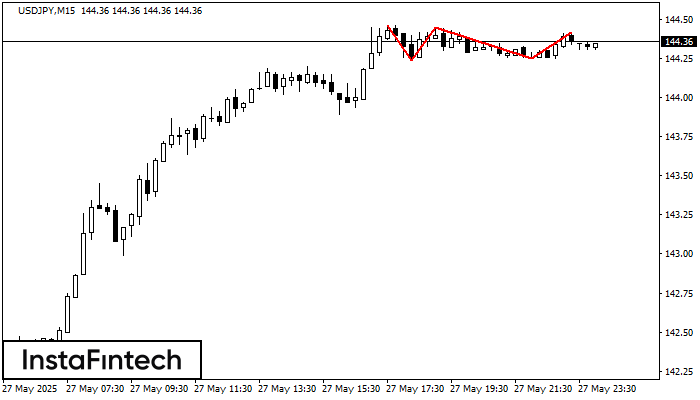
The Triple Top pattern has formed on the chart of the USDJPY M15 trading instrument. It is a reversal pattern featuring the following characteristics: resistance level 4, support level -1
The M5 and M15 time frames may have more false entry points.
Open chart in a new window


