

Долзарб паттернлар

Двойное дно
сформирован 03.04 в 17:09:50 (UTC+0)
сила сигнала 1 из 5
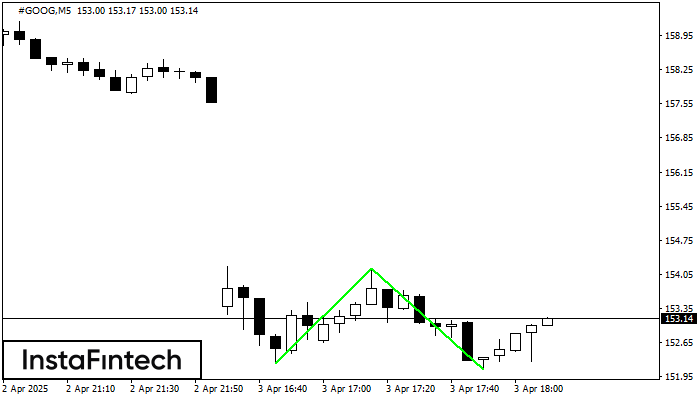
Сформирована фигура «Двойное дно» на графике #GOOG M5. Характеристика: Уровень поддержки 152.21; Уровень сопротивления 154.17; Ширина фигуры 196 пунктов. В случае пробоя уровня сопротивления можно будет прогнозировать изменение тенденции, где первая точка фиксации прибыли находится на расстоянии 207 пунктов.
Таймфреймы М5 и М15 могут иметь больше ложных точек входа.
- Все
- Все
- Bearish Rectangle
- Bearish Symmetrical Triangle
- Bearish Symmetrical Triangle
- Bullish Rectangle
- Double Top
- Double Top
- Triple Bottom
- Triple Bottom
- Triple Top
- Triple Top
- Все
- Все
- Покупка
- Продажа
- Все
- 1
- 2
- 3
- 4
- 5
Bearish Rectangle
was formed on 30.05 at 13:12:54 (UTC+0)
signal strength 1 of 5
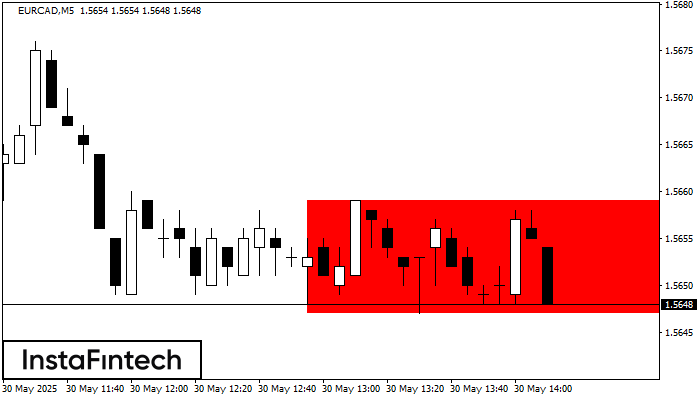
According to the chart of M5, EURCAD formed the Bearish Rectangle. The pattern indicates a trend continuation. The upper border is 1.5659, the lower border is 1.5647. The signal means
The M5 and M15 time frames may have more false entry points.
Open chart in a new window
Double Bottom
was formed on 30.05 at 12:31:28 (UTC+0)
signal strength 3 of 5
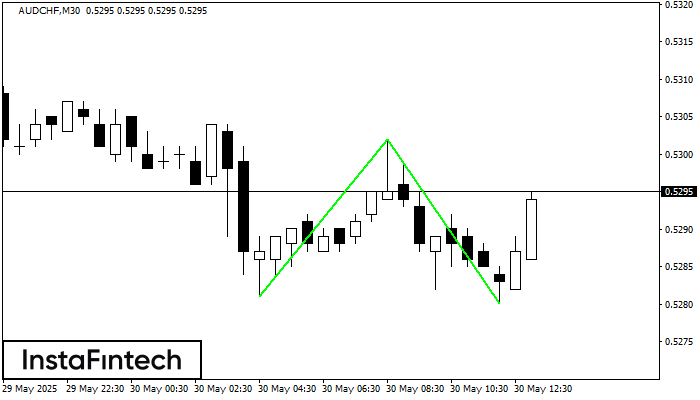
The Double Bottom pattern has been formed on AUDCHF M30. Characteristics: the support level 0.5281; the resistance level 0.5302; the width of the pattern 21 points. If the resistance level
Open chart in a new window
Double Bottom
was formed on 30.05 at 12:00:29 (UTC+0)
signal strength 2 of 5
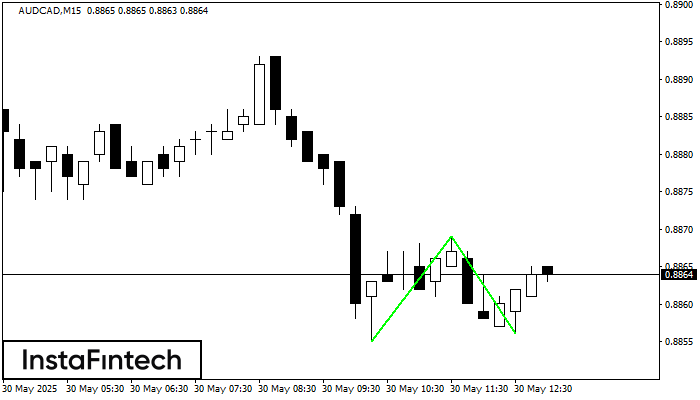
The Double Bottom pattern has been formed on AUDCAD M15; the upper boundary is 0.8869; the lower boundary is 0.8856. The width of the pattern is 14 points. In case
The M5 and M15 time frames may have more false entry points.
Open chart in a new window


