

Долзарб паттернлар

Двойное дно
сформирован 31.03 в 11:30:40 (UTC+0)
сила сигнала 1 из 5
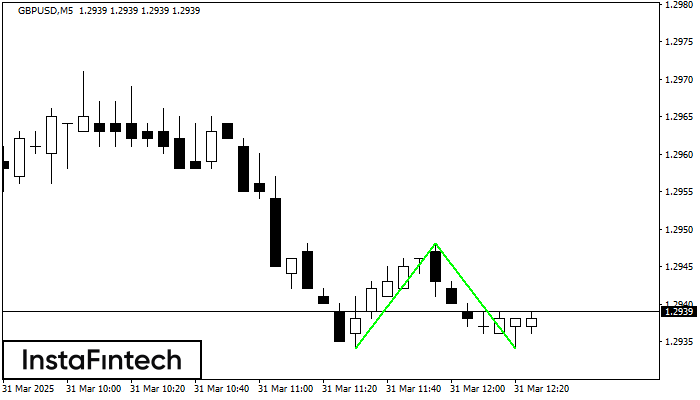
Сформирована фигура «Двойное дно» на графике GBPUSD M5. Верхняя граница 1.2948; Нижняя граница 1.2934; Ширина фигуры 14 пунктов. В случае пробоя верхней границы 1.2948 можно будет прогнозировать изменение тенденции, где ширина фигуры и будет являться расстоянием предположительного Тейк Профита.
Таймфреймы М5 и М15 могут иметь больше ложных точек входа.
- Все
- Все
- Bearish Rectangle
- Bearish Symmetrical Triangle
- Bearish Symmetrical Triangle
- Bullish Rectangle
- Double Top
- Double Top
- Triple Bottom
- Triple Bottom
- Triple Top
- Triple Top
- Все
- Все
- Покупка
- Продажа
- Все
- 1
- 2
- 3
- 4
- 5
बुलिश सिमेट्रिकल त्रिभुज
was formed on 28.05 at 10:04:32 (UTC+0)
signal strength 2 of 5
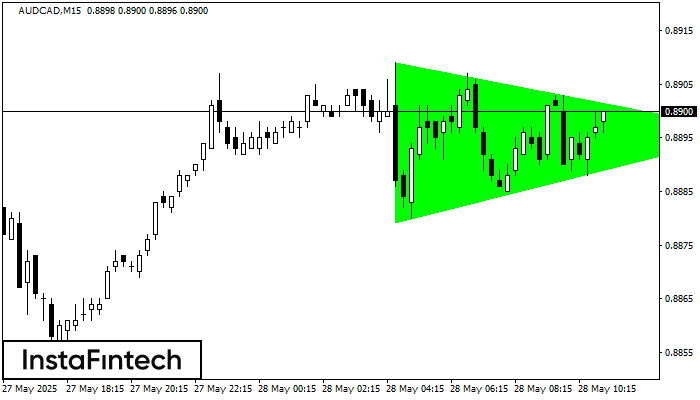
M15 के चार्ट के अनुसार, AUDCAD से बुलिश सिमेट्रिकल त्रिभुज पैटर्न बना। पैटर्न की निचली सीमा ने निर्देशांक 0.8879/0.8896 को स्पर्श किया जबकि ऊपरी सीमा 0.8909/0.8896 के पार गई। यदि
M5 और M15 समय सीमा में अधिक फाल्स एंट्री पॉइंट्स हो सकते हैं।
Open chart in a new window
बियरिश पताका
was formed on 28.05 at 08:12:58 (UTC+0)
signal strength 1 of 5

बियरिश पताका पैटर्न GBPJPY M5 चार्ट पर बना है। यह मौजूदा ट्रेंड कि संभावित निरंतरता का संकेत देता है। निर्दिष्टीकरण: पैटर्न का नीचल स्तर 194.35 पर है; फ्लैगपोल की ऊंचाई
M5 और M15 समय सीमा में अधिक फाल्स एंट्री पॉइंट्स हो सकते हैं।
Open chart in a new window
बुलिश सिमेट्रिकल त्रिभुज
was formed on 28.05 at 07:55:36 (UTC+0)
signal strength 1 of 5

M5 के चार्ट के अनुसार, GBPAUD से बुलिश सिमेट्रिकल त्रिभुज पैटर्न बना, जो दर्शाता है कि ट्रेंड जारी रहेगा। विवरण: पैटर्न की ऊपरी सीमा निर्देशांक 2.0988/2.0939 को स्पर्श करती है
M5 और M15 समय सीमा में अधिक फाल्स एंट्री पॉइंट्स हो सकते हैं।
Open chart in a new window


