

Долзарб паттернлар

Двойная вершина
сформирован 27.03 в 04:55:37 (UTC+0)
сила сигнала 1 из 5
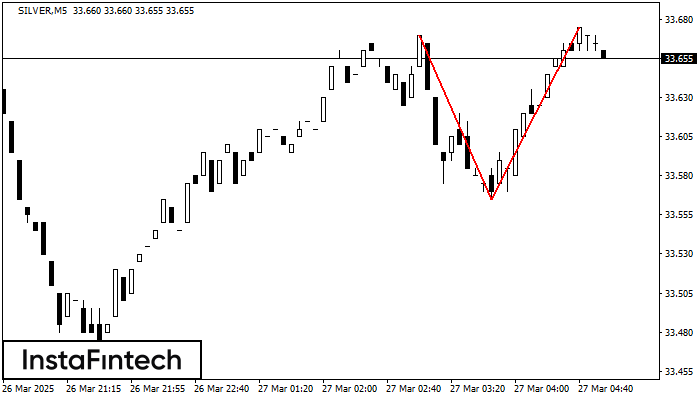
На торговом графике SILVER M5 сформировалась разворотная фигура «Двойная вершина». Характеристика: Верхняя граница 33.67; Нижняя граница 33.56; Ширина фигуры 110 пунктов. Сигнал: Пробой нижней границы 33.56 приведет к дальнейшему нисходящему движению с перспективой хода к уровню 33.55.
Таймфреймы М5 и М15 могут иметь больше ложных точек входа.
- Все
- Все
- Bearish Rectangle
- Bearish Symmetrical Triangle
- Bearish Symmetrical Triangle
- Bullish Rectangle
- Double Top
- Double Top
- Triple Bottom
- Triple Bottom
- Triple Top
- Triple Top
- Все
- Все
- Покупка
- Продажа
- Все
- 1
- 2
- 3
- 4
- 5
Double Bottom
was formed on 26.05 at 01:50:33 (UTC+0)
signal strength 1 of 5
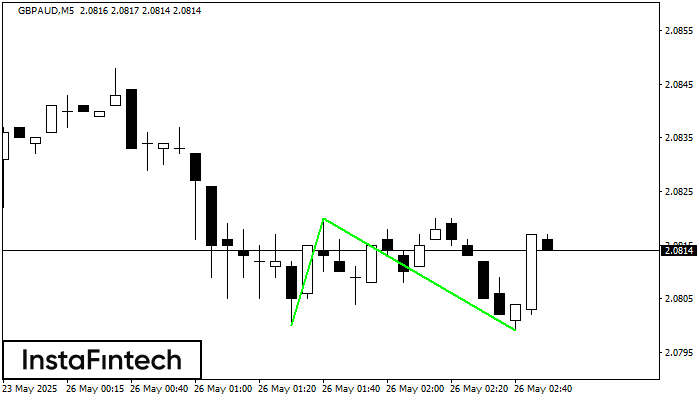
The Double Bottom pattern has been formed on GBPAUD M5. Characteristics: the support level 2.0800; the resistance level 2.0820; the width of the pattern 20 points. If the resistance level
The M5 and M15 time frames may have more false entry points.
Open chart in a new window
Bullish Symmetrical Triangle
was formed on 26.05 at 01:45:28 (UTC+0)
signal strength 1 of 5
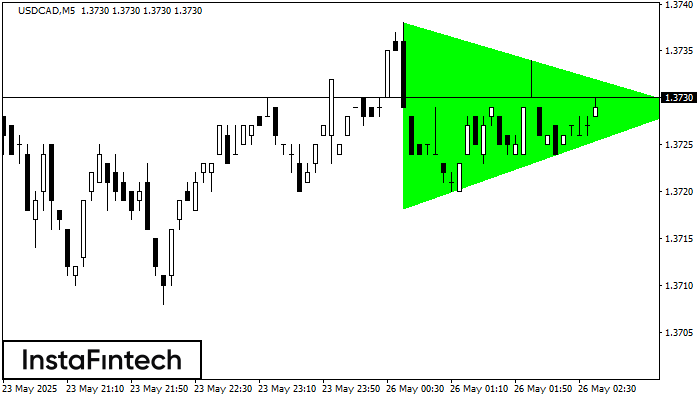
According to the chart of M5, USDCAD formed the Bullish Symmetrical Triangle pattern. The lower border of the pattern touches the coordinates 1.3718/1.3729 whereas the upper border goes across 1.3738/1.3729
The M5 and M15 time frames may have more false entry points.
Open chart in a new window
Bullish Flag
was formed on 26.05 at 01:42:07 (UTC+0)
signal strength 2 of 5
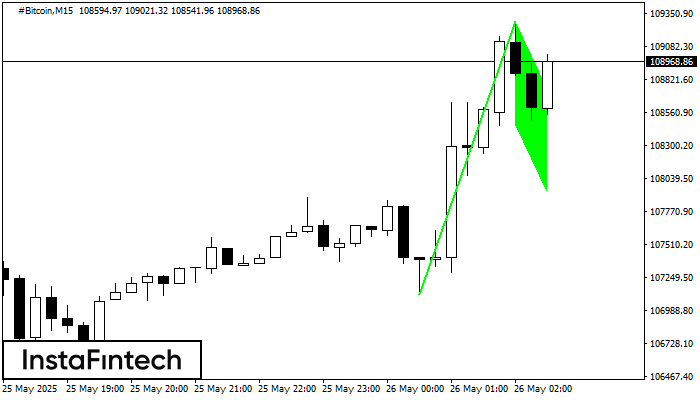
The Bullish Flag pattern has been formed on the chart #Bitcoin M15 which signals that the upward trend will continue. Signals: а break of the peak at 109285.25 may push
The M5 and M15 time frames may have more false entry points.
Open chart in a new window
