

Долзарб паттернлар

Бычий флаг
сформирован 10.03 в 13:49:20 (UTC+0)
сила сигнала 3 из 5
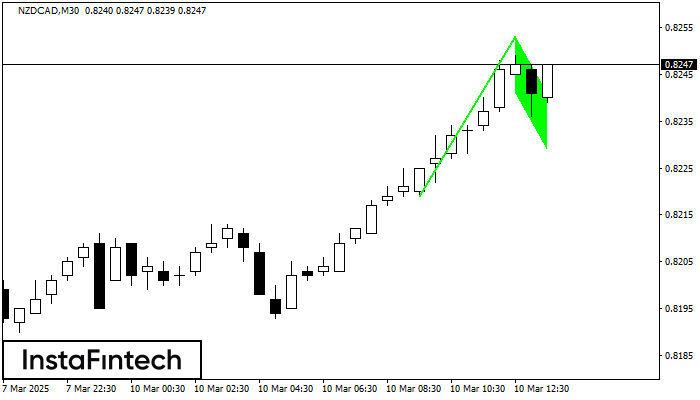
На графике NZDCAD M30 сформировалась фигура «Бычий флаг», которая сигнализирует о продолжении восходящего тренда. Сигналы: Пробой максимума фигуры 0.8253 может привести к продолжению восходящего движения, где рост инструмента будет являться проекцией высоты флагштока.
Шунингдек кўринг
- Все
- Все
- Bearish Rectangle
- Bearish Symmetrical Triangle
- Bearish Symmetrical Triangle
- Bullish Rectangle
- Double Top
- Double Top
- Triple Bottom
- Triple Bottom
- Triple Top
- Triple Top
- Все
- Все
- Покупка
- Продажа
- Все
- 1
- 2
- 3
- 4
- 5
Triple Top
was formed on 14.04 at 15:00:11 (UTC+0)
signal strength 3 of 5
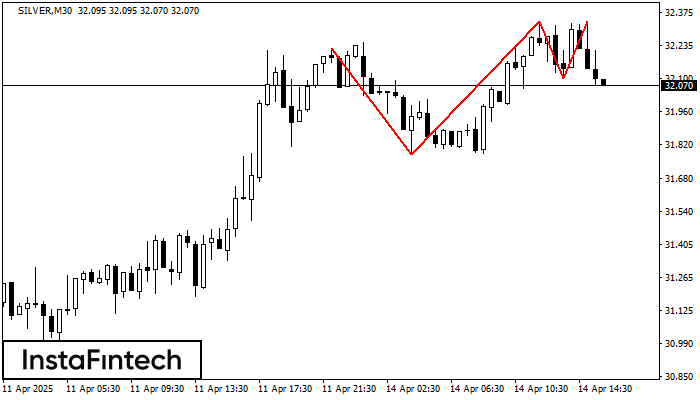
The Triple Top pattern has formed on the chart of the SILVER M30. Features of the pattern: borders have an ascending angle; the lower line of the pattern
Open chart in a new window
Bullish Rectangle
was formed on 14.04 at 15:00:08 (UTC+0)
signal strength 1 of 5
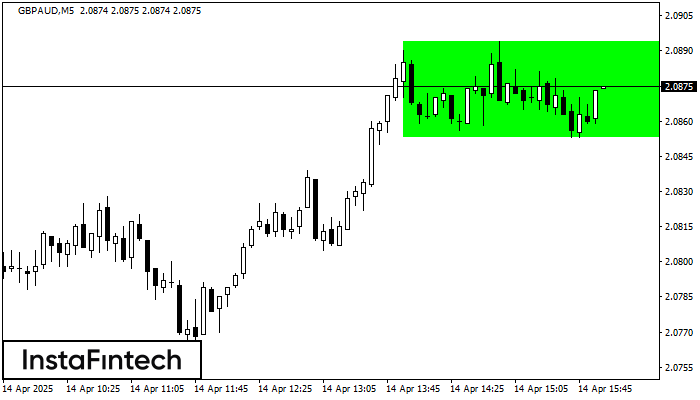
According to the chart of M5, GBPAUD formed the Bullish Rectangle. This type of a pattern indicates a trend continuation. It consists of two levels: resistance 2.0894 and support 2.0853
The M5 and M15 time frames may have more false entry points.
Open chart in a new window
Double Bottom
was formed on 14.04 at 14:45:10 (UTC+0)
signal strength 1 of 5
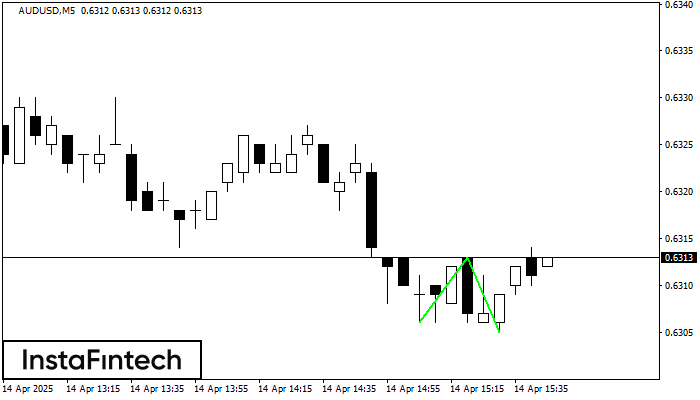
The Double Bottom pattern has been formed on AUDUSD M5; the upper boundary is 0.6313; the lower boundary is 0.6305. The width of the pattern is 7 points. In case
The M5 and M15 time frames may have more false entry points.
Open chart in a new window


