

Actual patterns

Patterns are graphical models which are formed in the chart by the price. According to one of the technical analysis postulates, history (price movement) repeats itself. It means that the price movements are often similar in the same situations which makes it possible to predict the further development of the situation with a high probability.
Relevant patterns by InstaTrade is an easy-to-use service which allows you to be aware of latest changes in the market and react to clues from the market in time. In our service you will always find the latest and most relevant patterns on any pair and any timeframe.
Double Top
was formed on 09.04 at 16:45:03 (UTC+0)
signal strength 1 of 5
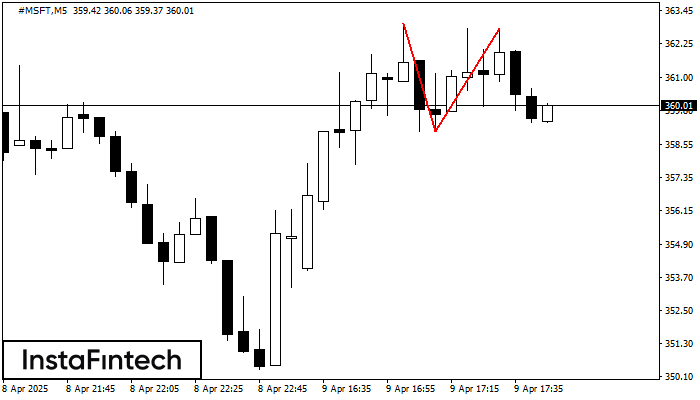
On the chart of #MSFT M5 the Double Top reversal pattern has been formed. Characteristics: the upper boundary 362.82; the lower boundary 359.05; the width of the pattern 377 points. The signal: a break of the lower boundary will cause continuation of the downward trend targeting the 358.90 level.
The M5 and M15 time frames may have more false entry points.
See Also
- All
- All
- Bearish Rectangle
- Bearish Symmetrical Triangle
- Bearish Symmetrical Triangle
- Bullish Rectangle
- Double Top
- Double Top
- Triple Bottom
- Triple Bottom
- Triple Top
- Triple Top
- All
- All
- Buy
- Sale
- All
- 1
- 2
- 3
- 4
- 5
รูปแบบกราฟจุดสองยอด (Double Top)
was formed on 13.11 at 16:20:18 (UTC+0)
signal strength 1 of 5
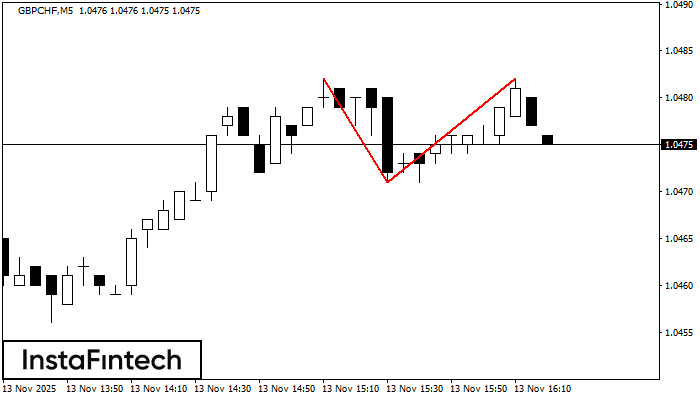
รูปแบบการย้อนตัว รูปแบบกราฟจุดสองยอด (Double Top) ได้ถูกสร้างขึ้นมาใน GBPCHF M5 คุณลักษณะ: ขอบเขตด้านบน 1.0482; ขอบเขตด้านล่าง 1.0471; ความกว้างของกราฟรูปแบบนี้คือ 11 จุด
ขอบเตระยะเวลาใน M5 และ M15 อาจจะมีตำแหน่งการเข้าใช้งานที่ผิดพลาดมากยิ่งขึ้น
Open chart in a new window
รูปแบบกราฟหัวและหัวไหล่ (Head and Shoulders)
was formed on 13.11 at 15:15:08 (UTC+0)
signal strength 2 of 5
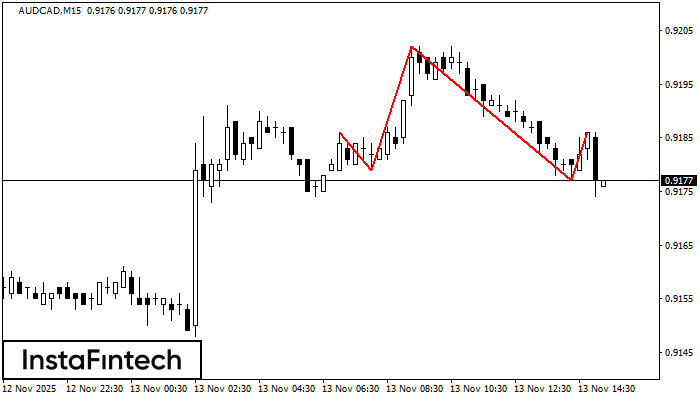
รูปแบบทางเทคนิค ทำให้เกิด รูปแบบกราฟหัวและหัวไหล่ (Head and Shoulders) ที่ปรากฎออกมาในชาร์ตของ AUDCAD M15 มีเหตุผลที่หนักแน่นอยู่หลายประการที่แสดงให้เห็นว่า ราคาจะมุ่งหน้าผ่านตำแหน่งส่วนคอ 0.9179/0.9177 หลังจากตำแหน่งส่วนหัวไหล่ด้านขวาได้ถูกสร้างขึ้นมา ดังนั้นแนวโน้มจะมีการเปลี่ยนแปลงพร้อมกับราคาที่จะมุ่งหน้าไปยัง0.9154
ขอบเตระยะเวลาใน M5 และ M15 อาจจะมีตำแหน่งการเข้าใช้งานที่ผิดพลาดมากยิ่งขึ้น
Open chart in a new window
รูปแบบกราฟธงขาขึ้น (Bullish Flag)
was formed on 13.11 at 13:30:14 (UTC+0)
signal strength 1 of 5
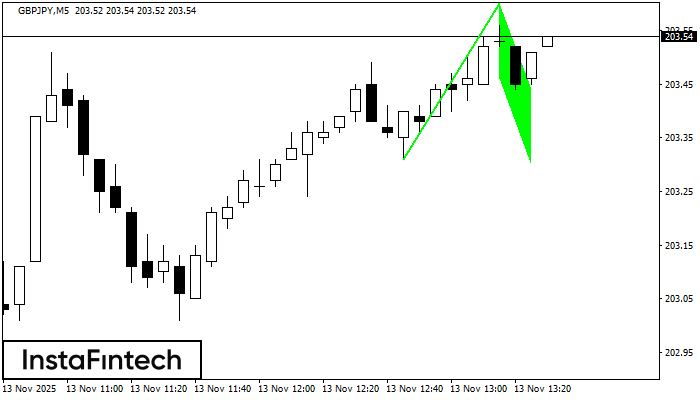
รูปแบบ รูปแบบกราฟธงขาขึ้น (Bullish Flag) ได้สร้างขึ้นมามาในชาร์ต GBPJPY M5 ซึ่งแสดงให้เห็นว่า แนวโน้มขาขึ้นจะเกิดขึ้นต่อไป สัญญาณ: การเคลื่อนตัวทะลุผ่านระดับสูงสุดที่ 203.60 อาจจะผลักดันราคาให้สูงขึ้นกว่าเดิม และการปรับตัวขึ้นจะเป็นระยะทางไปยังตัวเสา
ขอบเตระยะเวลาใน M5 และ M15 อาจจะมีตำแหน่งการเข้าใช้งานที่ผิดพลาดมากยิ่งขึ้น
Open chart in a new window


