

Corak sebenar

Triple Top
was formed on 25.04 at 08:30:10 (UTC+0)
signal strength 1 of 5
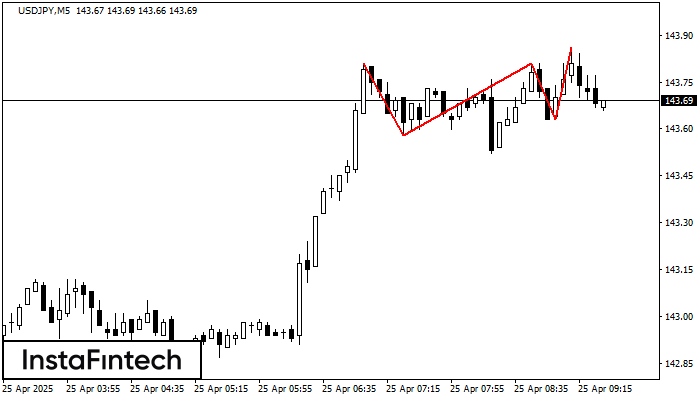
On the chart of the USDJPY M5 trading instrument, the Triple Top pattern that signals a trend change has formed. It is possible that after formation of the third peak, the price will try to break through the resistance level 143.58, where we advise to open a trading position for sale. Take profit is the projection of the pattern’s width, which is 23 points.
The M5 and M15 time frames may have more false entry points.
Juga lihat
- All
- All
- Bearish Rectangle
- Bearish Symmetrical Triangle
- Bearish Symmetrical Triangle
- Bullish Rectangle
- Double Top
- Double Top
- Triple Bottom
- Triple Bottom
- Triple Top
- Triple Top
- All
- All
- Buy
- Sale
- All
- 1
- 2
- 3
- 4
- 5
Head dan Shoulders
was formed on 22.05 at 17:00:26 (UTC+0)
signal strength 4 of 5
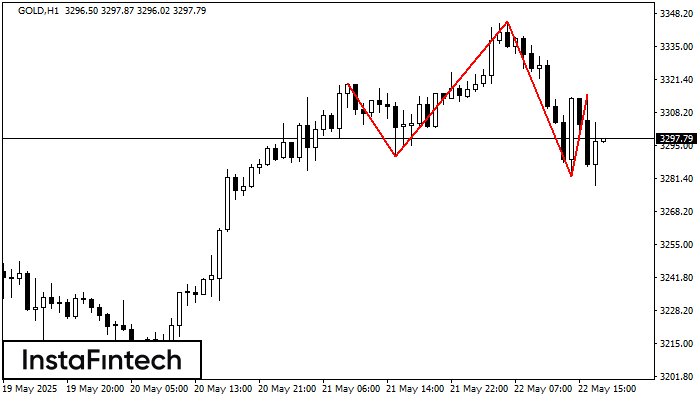
GOLD H1 membentuk corak Head dan Shoulders dengan ciri-ciri berikut: Bahagian atas Head adalah 3344.99, garisan Neck dan sudut menaik berada pada 3290.48/3282.56. Pembentukan corak ini boleh membawa perubahan dalam
Open chart in a new window
Segi Tiga Simetri Menurun
was formed on 22.05 at 16:50:59 (UTC+0)
signal strength 1 of 5
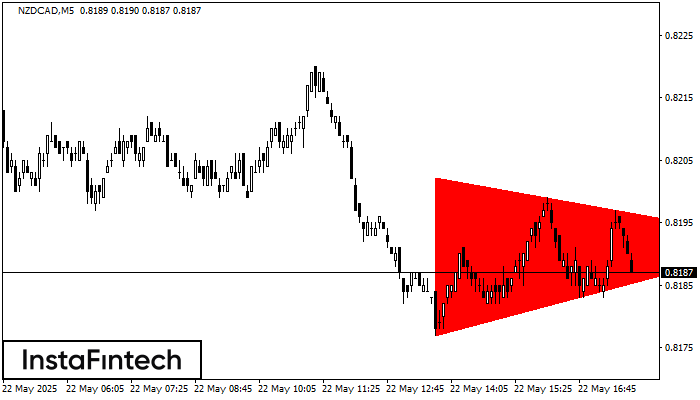
Berdasarkan carta M5, NZDCAD membentuk corak Segi Tiga Simetri Menurun. Penerangan: Sempadan yang lebih rendah ialah 0.8177/0.8192 dan sempadan atas adalah 0.8202/0.8192. Lebar corak diukur pada carta pada -25 pips
Carta masa M5 dan M15 mungkin mempunyai lebih banyak titik kemasukan palsu.
Open chart in a new window
Triple Bottom
was formed on 22.05 at 16:50:25 (UTC+0)
signal strength 1 of 5
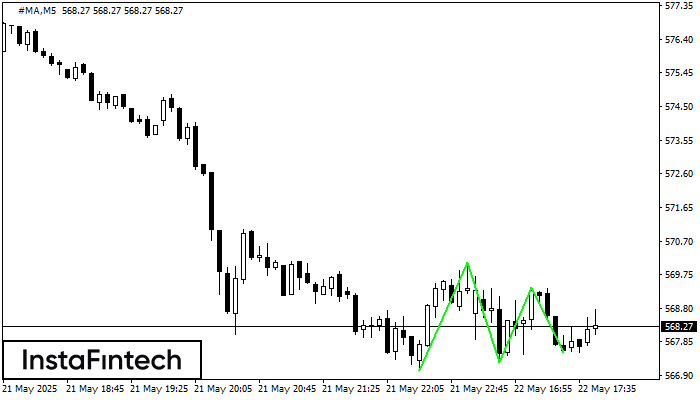
Corak Triple Bottom telah dibentuk pada #MA M5. Ia mempunyai ciri-ciri berikut: tahap rintangan 570.10/569.39; tahap sokongan 567.05/567.54; lebar corak adalah 305 mata. Dalam situasi penembusan paras rintangan 570.10, harga
Carta masa M5 dan M15 mungkin mempunyai lebih banyak titik kemasukan palsu.
Open chart in a new window


