

Corak sebenar

Bullish Symmetrical Triangle
was formed on 24.04 at 15:31:10 (UTC+0)
signal strength 1 of 5
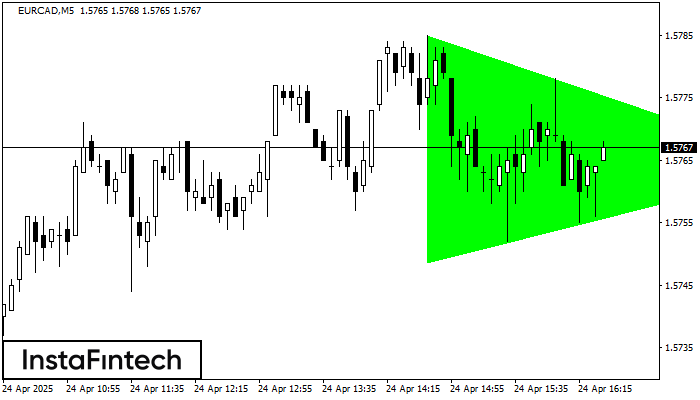
According to the chart of M5, EURCAD formed the Bullish Symmetrical Triangle pattern, which signals the trend will continue. Description. The upper border of the pattern touches the coordinates 1.5785/1.5764 whereas the lower border goes across 1.5749/1.5764. The pattern width is measured on the chart at 36 pips. If the Bullish Symmetrical Triangle pattern is in progress during the upward trend, this indicates the current trend will go on. In case 1.5764 is broken, the price could continue its move toward 1.5779.
The M5 and M15 time frames may have more false entry points.
Juga lihat
- All
- All
- Bearish Rectangle
- Bearish Symmetrical Triangle
- Bearish Symmetrical Triangle
- Bullish Rectangle
- Double Top
- Double Top
- Triple Bottom
- Triple Bottom
- Triple Top
- Triple Top
- All
- All
- Buy
- Sale
- All
- 1
- 2
- 3
- 4
- 5
Segi Empat Menurun
was formed on 30.05 at 15:34:48 (UTC+0)
signal strength 2 of 5
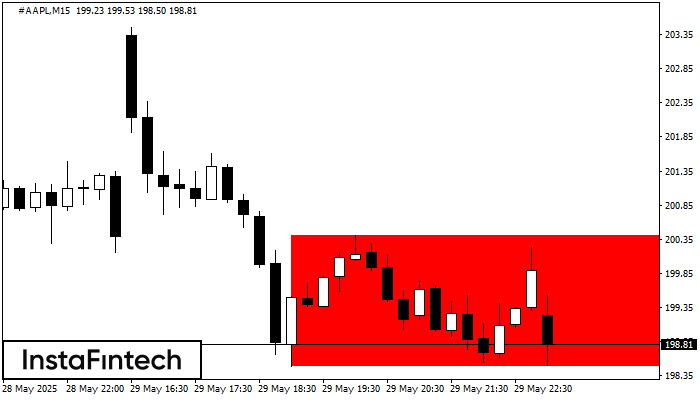
Berdasarkan carta M15, #AAPL telah membentuk Segi Empat Menurun. Corak ini menunjukkan kesinambungan aliran. Sempadan atas adalah 200.40, sempadan bawah adalah 198.49. Isyarat bermakna bahawa kedudukan pendek perlu dibuka selepas
Carta masa M5 dan M15 mungkin mempunyai lebih banyak titik kemasukan palsu.
Open chart in a new window
Double Bottom
was formed on 30.05 at 15:30:16 (UTC+0)
signal strength 2 of 5
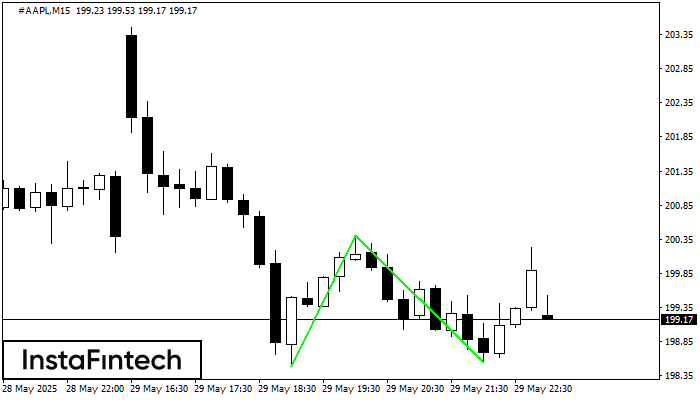
Corak Double Bottom telah dibentuk pada #AAPL M15. Ciri-ciri: tahap sokongan 198.49; tahap rintangan 200.40; lebar corak 191 mata. Sekiranya tahap rintangan ditembusi, perubahan aliran boleh diramalkan dengan titik sasaran
Carta masa M5 dan M15 mungkin mempunyai lebih banyak titik kemasukan palsu.
Open chart in a new window
Inverse Head dan Shoulder
was formed on 30.05 at 15:25:34 (UTC+0)
signal strength 1 of 5
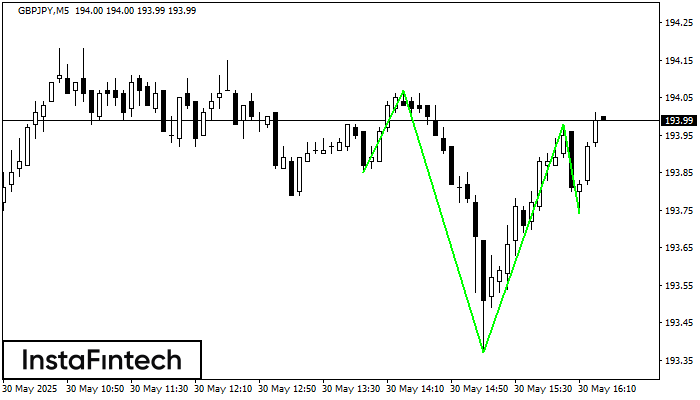
According to M5, GBPJPY is shaping the technical pattern – the Inverse Head dan Shoulder. In case the Neckline 194.07/193.98 is broken out, the instrument is likely to move toward
Carta masa M5 dan M15 mungkin mempunyai lebih banyak titik kemasukan palsu.
Open chart in a new window


