

Corak sebenar

Head and Shoulders
was formed on 24.04 at 00:10:29 (UTC+0)
signal strength 1 of 5
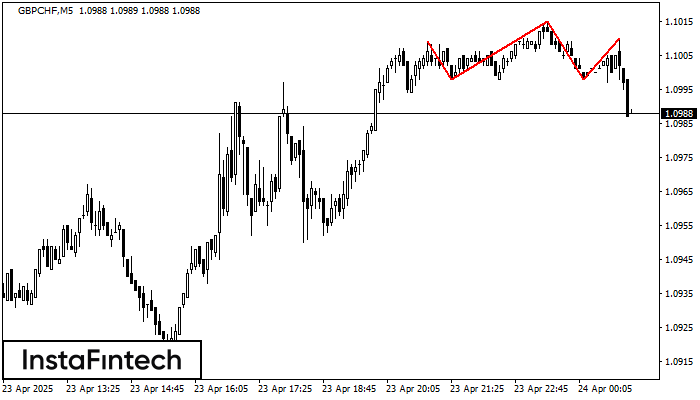
According to the chart of M5, GBPCHF formed the Head and Shoulders pattern. The Head’s top is set at 1.1015 while the median line of the Neck is found at 1.0998/1.0998. The formation of the Head and Shoulders pattern evidently signals a reversal of the upward trend. In other words, in case the scenario comes true, the price of GBPCHF will go towards 1.0983.
The M5 and M15 time frames may have more false entry points.
- All
- All
- Bearish Rectangle
- Bearish Symmetrical Triangle
- Bearish Symmetrical Triangle
- Bullish Rectangle
- Double Top
- Double Top
- Triple Bottom
- Triple Bottom
- Triple Top
- Triple Top
- All
- All
- Buy
- Sale
- All
- 1
- 2
- 3
- 4
- 5
Double Bottom
was formed on 26.05 at 03:00:31 (UTC+0)
signal strength 4 of 5
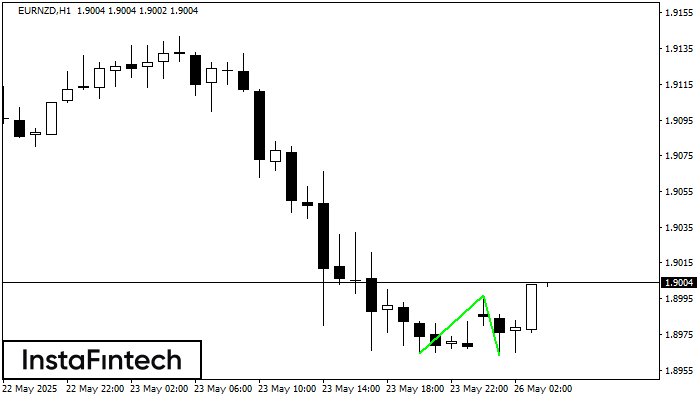
Corak Double Bottom telah dibentuk pada EURNZD H1. Pembentukan ini menandakan pembalikan aliran dari aliran menurun ke atas. Isyarat ialah perdagangan membeli harus dibuka selepas sempadan atas corak 1.8997 telah
Open chart in a new window
Double Top
was formed on 26.05 at 03:00:31 (UTC+0)
signal strength 1 of 5
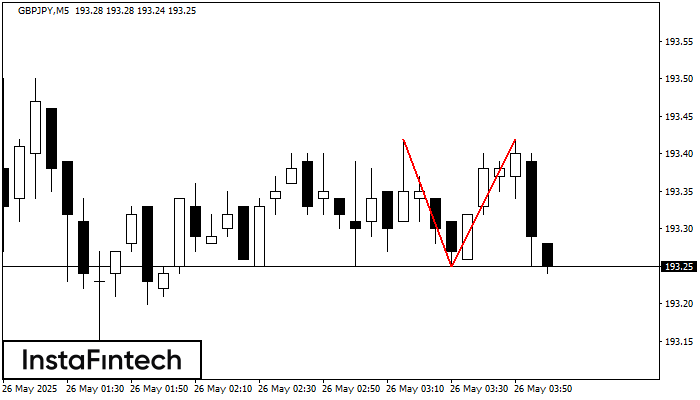
Pada carta GBPJPY M5 corak pembalikan Double Top telah terbentuk. Ciri-ciri: sempadan atas 193.42; sempadan bawah 193.25; lebar corak 17 mata. Isyarat: penembusan sempadan bawah akan menyebabkan kesinambungan arah aliran
Carta masa M5 dan M15 mungkin mempunyai lebih banyak titik kemasukan palsu.
Open chart in a new window
Head dan Shoulders
was formed on 26.05 at 02:56:04 (UTC+0)
signal strength 1 of 5
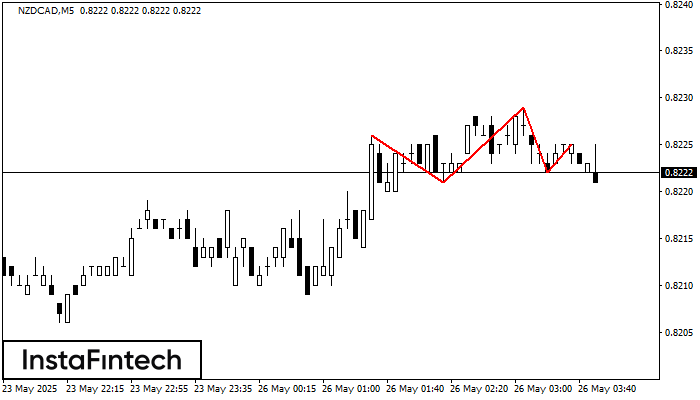
NZDCAD M5 membentuk corak Head dan Shoulders dengan ciri-ciri berikut: Bahagian atas Head adalah 0.8229, garisan Neck dan sudut menaik berada pada 0.8221/0.8222. Pembentukan corak ini boleh membawa perubahan dalam
Carta masa M5 dan M15 mungkin mempunyai lebih banyak titik kemasukan palsu.
Open chart in a new window

