

Corak sebenar

Head and Shoulders
was formed on 23.04 at 22:55:23 (UTC+0)
signal strength 1 of 5
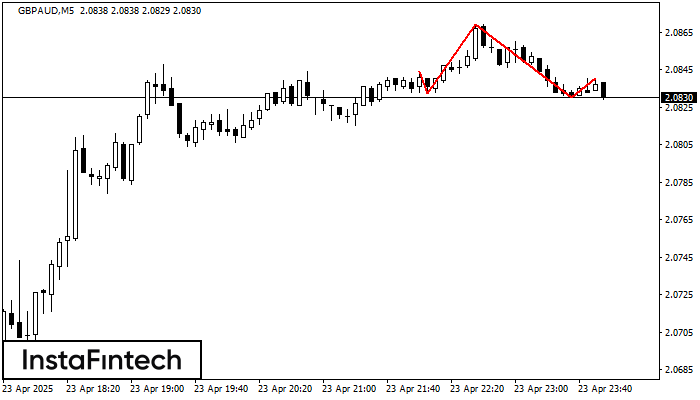
According to the chart of M5, GBPAUD formed the Head and Shoulders pattern. The Head’s top is set at 2.0869 while the median line of the Neck is found at 2.0832/2.0830. The formation of the Head and Shoulders pattern evidently signals a reversal of the upward trend. In other words, in case the scenario comes true, the price of GBPAUD will go towards 2.0815.
The M5 and M15 time frames may have more false entry points.
- All
- All
- Bearish Rectangle
- Bearish Symmetrical Triangle
- Bearish Symmetrical Triangle
- Bullish Rectangle
- Double Top
- Double Top
- Triple Bottom
- Triple Bottom
- Triple Top
- Triple Top
- All
- All
- Buy
- Sale
- All
- 1
- 2
- 3
- 4
- 5
Прямоугольник
сформирован 27.05 в 21:40:25 (UTC+0)
сила сигнала 1 из 5
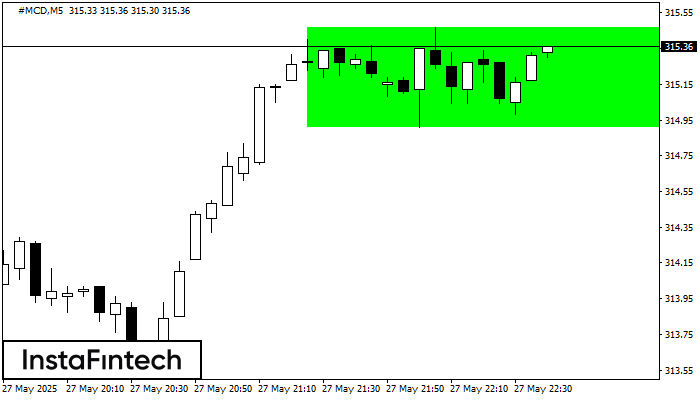
Сформирована фигура «Прямоугольник» на графике #MCD M5. Тип фигуры: Продолжение тренда; Границы: Верхняя 315.47, Нижняя 314.91; Сигнал: позицию на покупку следует открывать выше верхней границы прямоугольника 315.47
Таймфреймы М5 и М15 могут иметь больше ложных точек входа.
Открыть график инструмента в новом окне
Двойная вершина
сформирован 27.05 в 21:35:15 (UTC+0)
сила сигнала 1 из 5
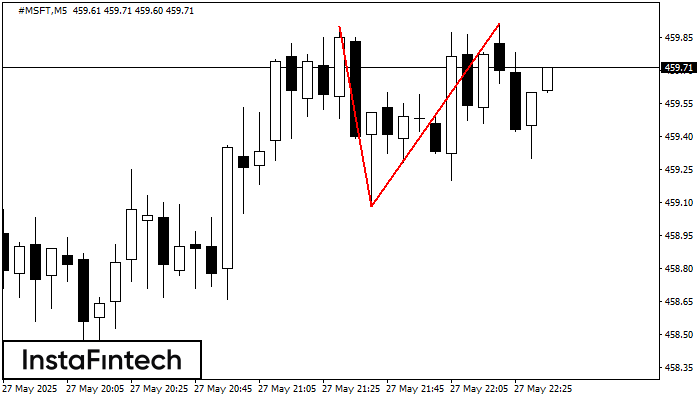
На торговом графике #MSFT M5 сформировалась разворотная фигура «Двойная вершина». Характеристика: Верхняя граница 459.91; Нижняя граница 459.08; Ширина фигуры 83 пунктов. Сигнал: Пробой нижней границы 459.08 приведет к дальнейшему нисходящему
Таймфреймы М5 и М15 могут иметь больше ложных точек входа.
Открыть график инструмента в новом окне
Двойная вершина
сформирован 27.05 в 21:30:25 (UTC+0)
сила сигнала 1 из 5
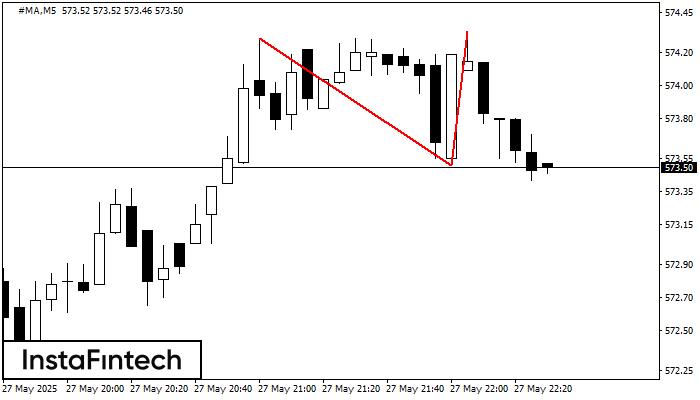
На торговом графике #MA M5 сформировалась разворотная фигура «Двойная вершина». Характеристика: Верхняя граница 574.33; Нижняя граница 573.51; Ширина фигуры 82 пунктов. Сигнал: Пробой нижней границы 573.51 приведет к дальнейшему нисходящему
Таймфреймы М5 и М15 могут иметь больше ложных точек входа.
Открыть график инструмента в новом окне


