

Corak sebenar

Bullish Rectangle
was formed on 23.04 at 17:45:08 (UTC+0)
signal strength 1 of 5
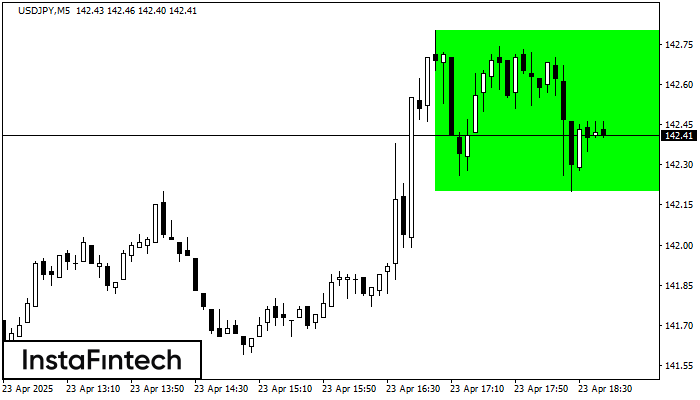
According to the chart of M5, USDJPY formed the Bullish Rectangle which is a pattern of a trend continuation. The pattern is contained within the following borders: the lower border 142.20 – 142.20 and upper border 142.80 – 142.80. In case the upper border is broken, the instrument is likely to follow the upward trend.
The M5 and M15 time frames may have more false entry points.
Juga lihat
- All
- All
- Bearish Rectangle
- Bearish Symmetrical Triangle
- Bearish Symmetrical Triangle
- Bullish Rectangle
- Double Top
- Double Top
- Triple Bottom
- Triple Bottom
- Triple Top
- Triple Top
- All
- All
- Buy
- Sale
- All
- 1
- 2
- 3
- 4
- 5
Persegi Bearish
was formed on 29.05 at 13:36:16 (UTC+0)
signal strength 1 of 5
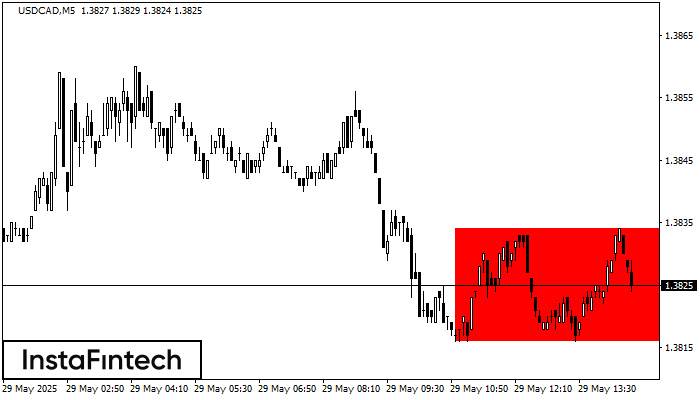
Menurut grafik dari M5, USDCAD terbentuk Persegi Bearish yang merupakan pola dari kelanjutan tren. Pola terkandung di dalam batas berikut: batas lebih rendah 1.3816 – 1.3816 dan batas atas 1.3834
Rangka waktu M5 dan M15 mungkin memiliki lebih dari titik entri yang keliru.
Open chart in a new window
Teratas Ganda
was formed on 29.05 at 13:09:57 (UTC+0)
signal strength 1 of 5
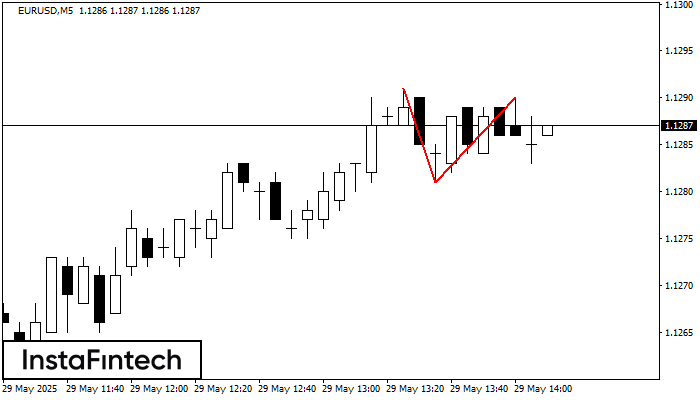
Pola reversal Teratas Ganda telah terbentuk pada EURUSD M5. Karakteristik: batas atas 1.1291; batas bawah 1.1281; lebar pola 9 poin. Transaksi jual lebih baik dibuka di bawah batas bawah 1.1281
Rangka waktu M5 dan M15 mungkin memiliki lebih dari titik entri yang keliru.
Open chart in a new window
Bawah Ganda
was formed on 29.05 at 12:59:54 (UTC+0)
signal strength 2 of 5
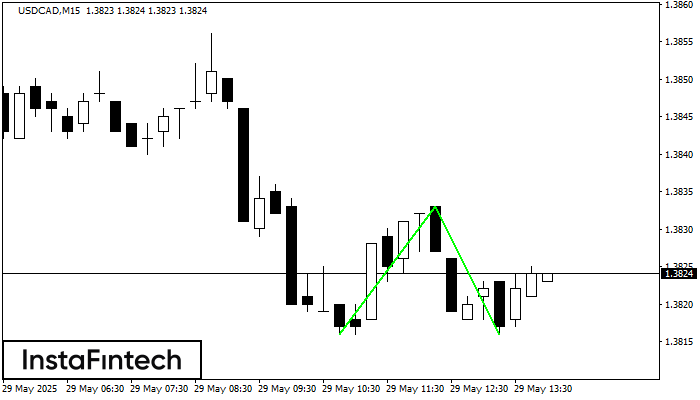
Pola Bawah Ganda telah terbentuk pada USDCAD M15. Formasi ini mensinyalkan reversal tren dari arah penurunan ke arah kenaikan. Sinyal menunjukkan bahwa transaksi beli harus dibuka setelah batas atas pola
Rangka waktu M5 dan M15 mungkin memiliki lebih dari titik entri yang keliru.
Open chart in a new window


