

Corak sebenar

Triple Top
was formed on 23.04 at 17:30:02 (UTC+0)
signal strength 2 of 5
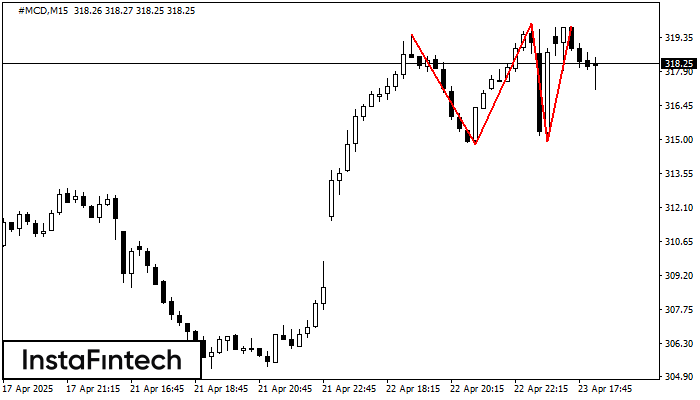
The Triple Top pattern has formed on the chart of the #MCD M15 trading instrument. It is a reversal pattern featuring the following characteristics: resistance level -33, support level -14, and pattern’s width 469. Forecast If the price breaks through the support level 314.80, it is likely to move further down to 319.74.
The M5 and M15 time frames may have more false entry points.
- All
- All
- Bearish Rectangle
- Bearish Symmetrical Triangle
- Bearish Symmetrical Triangle
- Bullish Rectangle
- Double Top
- Double Top
- Triple Bottom
- Triple Bottom
- Triple Top
- Triple Top
- All
- All
- Buy
- Sale
- All
- 1
- 2
- 3
- 4
- 5
Segi Empat Menaik
was formed on 25.05 at 07:55:30 (UTC+0)
signal strength 1 of 5

Berdasarkan carta M5, #Bitcoin telah membentuk Segi Empat Menaik yang merupakan corak kesinambungan aliran. Corak adalah terkandung dalam sempadan berikut: sempadan bawah 107891.05 – 107891.05 dan sempadan atas 108246.73 –
Carta masa M5 dan M15 mungkin mempunyai lebih banyak titik kemasukan palsu.
Open chart in a new window
Segi Tiga Simetri Menaik
was formed on 24.05 at 18:46:25 (UTC+0)
signal strength 2 of 5

Berdasarkan carta M15, #Bitcoin membentuk corak Segi Tiga Simetri Menaik yang menandakan aliran akan berterusan. Penerangan. Sempadan atas corak menyentuh koordinat 109440.14/108872.57 sedangkan sempadan bawah merentasi 108311.13/108872.57. Lebar corak diukur
Carta masa M5 dan M15 mungkin mempunyai lebih banyak titik kemasukan palsu.
Open chart in a new window
Segi Empat Menurun
was formed on 23.05 at 23:00:20 (UTC+0)
signal strength 1 of 5

Berdasarkan carta M5, EURNZD telah membentuk Segi Empat Menurun. Corak ini menunjukkan kesinambungan aliran. Sempadan atas adalah 1.8982, sempadan bawah adalah 1.8964. Isyarat bermakna bahawa kedudukan pendek perlu dibuka selepas
Carta masa M5 dan M15 mungkin mempunyai lebih banyak titik kemasukan palsu.
Open chart in a new window


