

Corak sebenar

Bullish Rectangle
was formed on 22.04 at 22:14:12 (UTC+0)
signal strength 1 of 5

According to the chart of M5, GBPCHF formed the Bullish Rectangle which is a pattern of a trend continuation. The pattern is contained within the following borders: the lower border 1.0906 – 1.0906 and upper border 1.0920 – 1.0920. In case the upper border is broken, the instrument is likely to follow the upward trend.
The M5 and M15 time frames may have more false entry points.
Juga lihat
- All
- All
- Bearish Rectangle
- Bearish Symmetrical Triangle
- Bearish Symmetrical Triangle
- Bullish Rectangle
- Double Top
- Double Top
- Triple Bottom
- Triple Bottom
- Triple Top
- Triple Top
- All
- All
- Buy
- Sale
- All
- 1
- 2
- 3
- 4
- 5
Segi Empat Menurun
was formed on 04.06 at 00:07:32 (UTC+0)
signal strength 1 of 5
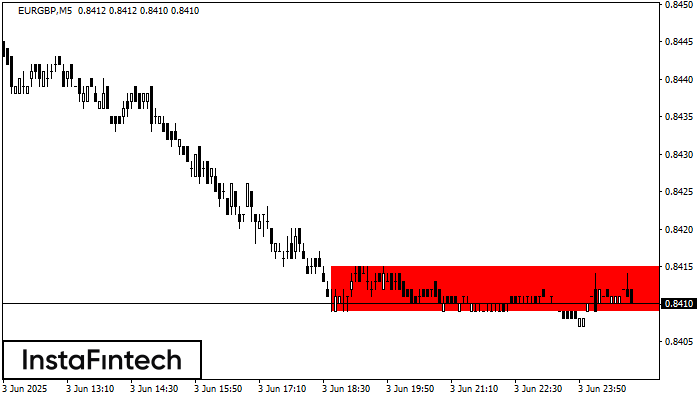
Berdasarkan carta M5, EURGBP telah membentuk Segi Empat Menurun yang merupakan corak kesinambungan aliran. Corak terkandung dalam sempadan berikut: sempadan bawah 0.8409 – 0.8409 dan sempadan atas 0.8415 – 0.8415
Carta masa M5 dan M15 mungkin mempunyai lebih banyak titik kemasukan palsu.
Open chart in a new window
Segi Empat Menaik
was formed on 03.06 at 23:47:07 (UTC+0)
signal strength 1 of 5
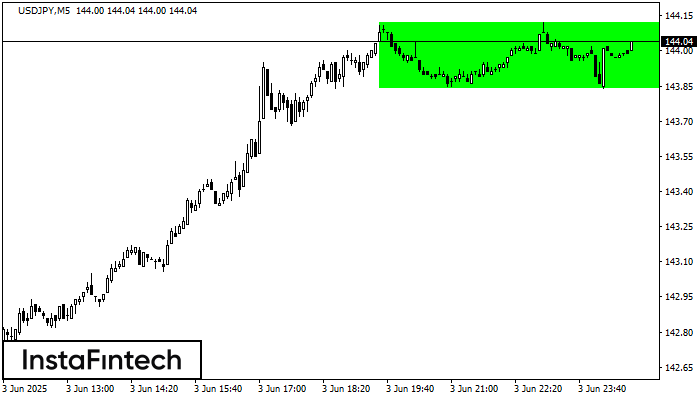
Berdasarkan carta M5, USDJPY telah membentuk Segi Empat Menaik. Jenis corak ini menunjukkan kesinambungan aliran. Ia terdiri daripada dua tahap: rintangan 144.12 dan sokongan 143.84. Sekiranya tahap rintangan 144.12
Carta masa M5 dan M15 mungkin mempunyai lebih banyak titik kemasukan palsu.
Open chart in a new window
Segi Empat Menaik
was formed on 03.06 at 23:46:54 (UTC+0)
signal strength 2 of 5
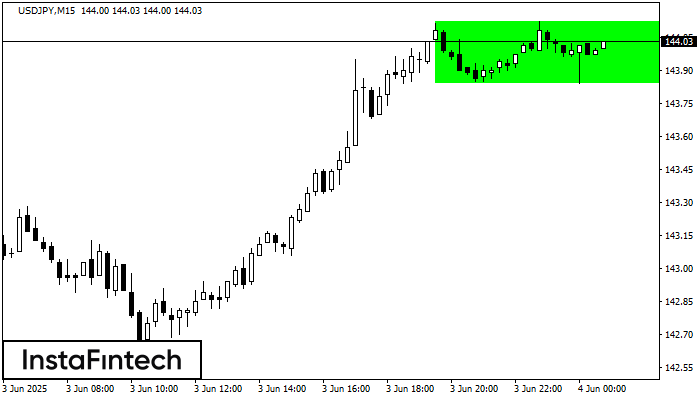
Berdasarkan carta M15, USDJPY telah membentuk Segi Empat Menaik yang merupakan corak kesinambungan aliran. Corak adalah terkandung dalam sempadan berikut: sempadan bawah 143.84 – 143.84 dan sempadan atas 144.12 –
Carta masa M5 dan M15 mungkin mempunyai lebih banyak titik kemasukan palsu.
Open chart in a new window


