

Corak sebenar

Bullish Symmetrical Triangle
was formed on 22.04 at 20:06:01 (UTC+0)
signal strength 1 of 5
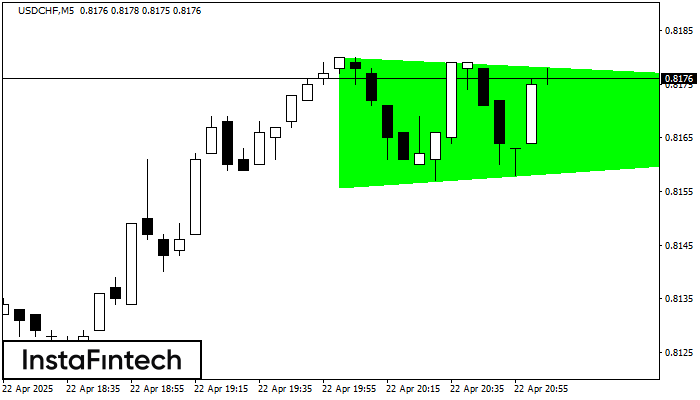
According to the chart of M5, USDCHF formed the Bullish Symmetrical Triangle pattern, which signals the trend will continue. Description. The upper border of the pattern touches the coordinates 0.8180/0.8170 whereas the lower border goes across 0.8156/0.8170. The pattern width is measured on the chart at 24 pips. If the Bullish Symmetrical Triangle pattern is in progress during the upward trend, this indicates the current trend will go on. In case 0.8170 is broken, the price could continue its move toward 0.8185.
The M5 and M15 time frames may have more false entry points.
- All
- All
- Bearish Rectangle
- Bearish Symmetrical Triangle
- Bearish Symmetrical Triangle
- Bullish Rectangle
- Double Top
- Double Top
- Triple Bottom
- Triple Bottom
- Triple Top
- Triple Top
- All
- All
- Buy
- Sale
- All
- 1
- 2
- 3
- 4
- 5
Pennant Aliran Menurun
was formed on 02.06 at 09:40:38 (UTC+0)
signal strength 1 of 5
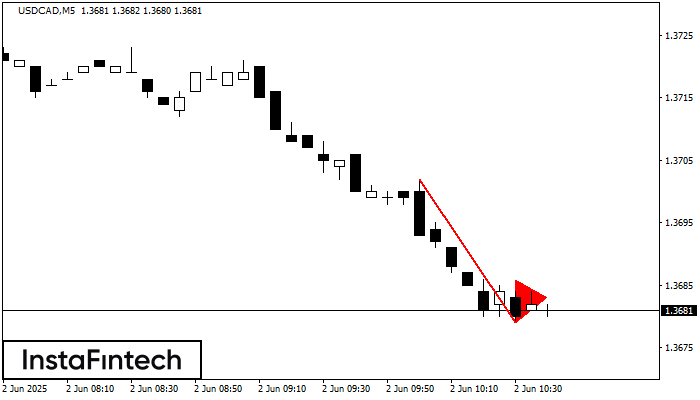
Corak Pennant Aliran Menurun telah dibentuk pada carta USDCAD M5. Ia menandakan potensi kesinambungan aliran yang sedia ada. Spesifikasi: bahagian corak mempunyai koordinat 1.3679; unjuran ketinggian flagpole adalah sama dengan
Carta masa M5 dan M15 mungkin mempunyai lebih banyak titik kemasukan palsu.
Open chart in a new window
Segi Tiga Simetri Menaik
was formed on 02.06 at 09:22:12 (UTC+0)
signal strength 4 of 5

Berdasarkan carta H1, EURJPY membentuk corak Segi Tiga Simetri Menaik. Sempadan yang lebih rendah bagi corak yang menyentuh koordinat 162.28/163.37 di mana sempadan atas merentasi 164.23/163.37. Sekiranya corak Segi Tiga
Open chart in a new window
Double Bottom
was formed on 02.06 at 09:00:13 (UTC+0)
signal strength 3 of 5

Corak Double Bottom telah dibentuk pada GBPJPY M30. Ciri-ciri: tahap sokongan 193.37; tahap rintangan 194.63; lebar corak 126 mata. Sekiranya tahap rintangan ditembusi, perubahan aliran boleh diramalkan dengan titik sasaran
Open chart in a new window

