

Corak sebenar

Double Bottom
was formed on 21.04 at 11:29:53 (UTC+0)
signal strength 1 of 5
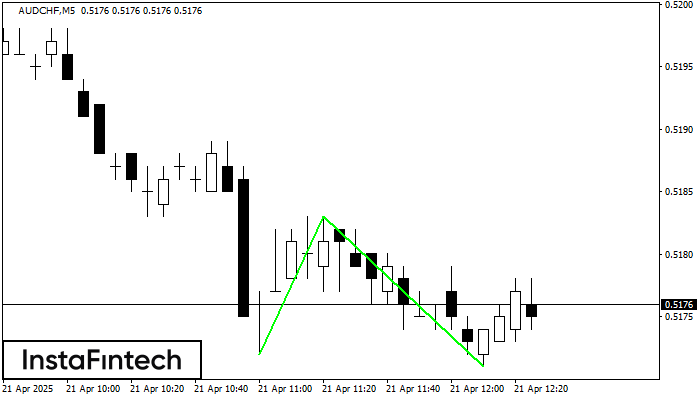
The Double Bottom pattern has been formed on AUDCHF M5. This formation signals a reversal of the trend from downwards to upwards. The signal is that a buy trade should be opened after the upper boundary of the pattern 0.5183 is broken. The further movements will rely on the width of the current pattern 11 points.
The M5 and M15 time frames may have more false entry points.
- All
- All
- Bearish Rectangle
- Bearish Symmetrical Triangle
- Bearish Symmetrical Triangle
- Bullish Rectangle
- Double Top
- Double Top
- Triple Bottom
- Triple Bottom
- Triple Top
- Triple Top
- All
- All
- Buy
- Sale
- All
- 1
- 2
- 3
- 4
- 5
Triple Top
was formed on 23.05 at 20:45:11 (UTC+0)
signal strength 1 of 5
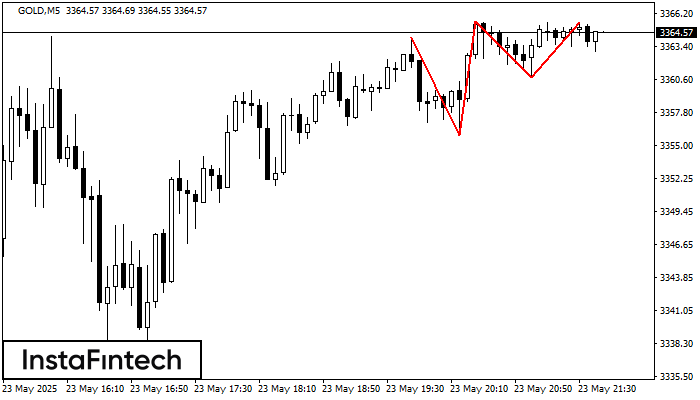
On the chart of the GOLD M5 trading instrument, the Triple Top pattern that signals a trend change has formed. It is possible that after formation of the third peak
The M5 and M15 time frames may have more false entry points.
Open chart in a new window
Double Top
was formed on 23.05 at 20:30:24 (UTC+0)
signal strength 2 of 5
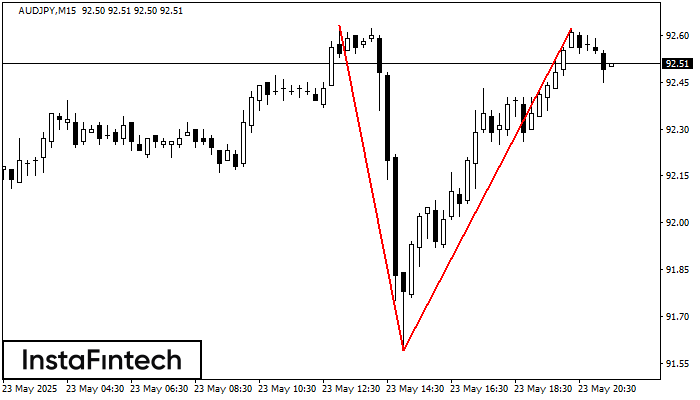
The Double Top pattern has been formed on AUDJPY M15. It signals that the trend has been changed from upwards to downwards. Probably, if the base of the pattern 91.59
The M5 and M15 time frames may have more false entry points.
Open chart in a new window
Double Top
was formed on 23.05 at 20:30:24 (UTC+0)
signal strength 2 of 5
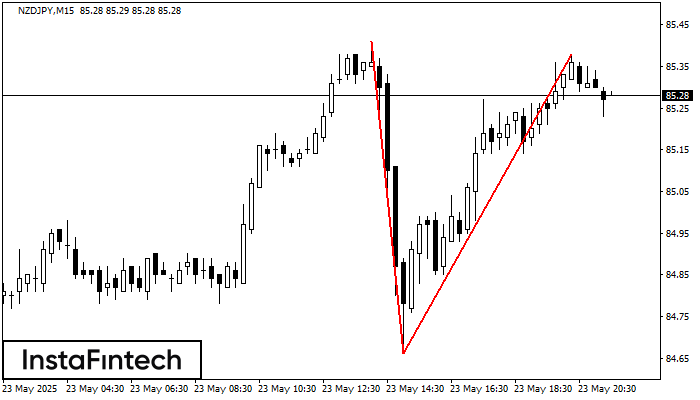
The Double Top pattern has been formed on NZDJPY M15. It signals that the trend has been changed from upwards to downwards. Probably, if the base of the pattern 84.66
The M5 and M15 time frames may have more false entry points.
Open chart in a new window


