

Corak sebenar

Bearish Rectangle
was formed on 17.04 at 11:10:15 (UTC+0)
signal strength 1 of 5

According to the chart of M5, GOLD formed the Bearish Rectangle which is a pattern of a trend continuation. The pattern is contained within the following borders: lower border 3312.24 – 3312.24 and upper border 3324.83 – 3324.83. In case the lower border is broken, the instrument is likely to follow the downward trend.
The M5 and M15 time frames may have more false entry points.
Juga lihat
- All
- All
- Bearish Rectangle
- Bearish Symmetrical Triangle
- Bearish Symmetrical Triangle
- Bullish Rectangle
- Double Top
- Double Top
- Triple Bottom
- Triple Bottom
- Triple Top
- Triple Top
- All
- All
- Buy
- Sale
- All
- 1
- 2
- 3
- 4
- 5
Bearish Symmetrical Triangle
was formed on 06.06 at 09:32:08 (UTC+0)
signal strength 1 of 5
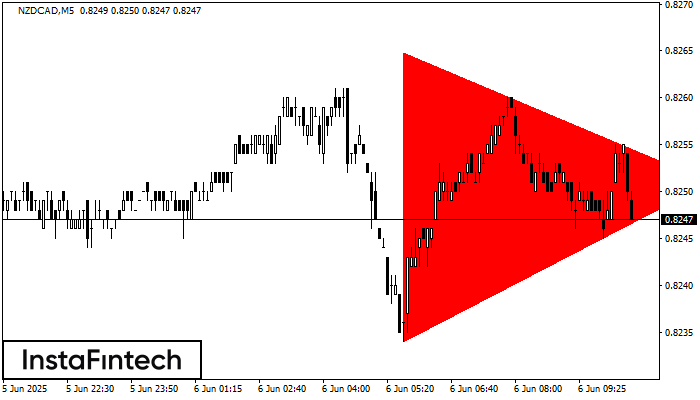
According to the chart of M5, NZDCAD formed the Bearish Symmetrical Triangle pattern. Description: The lower border is 0.8234/0.8251 and upper border is 0.8265/0.8251. The pattern width is measured
The M5 and M15 time frames may have more false entry points.
Open chart in a new window
Bearish Symmetrical Triangle
was formed on 06.06 at 09:32:08 (UTC+0)
signal strength 3 of 5
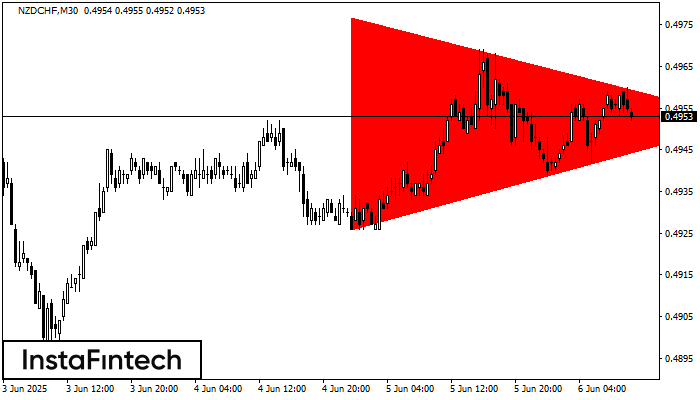
According to the chart of M30, NZDCHF formed the Bearish Symmetrical Triangle pattern. This pattern signals a further downward trend in case the lower border 0.4926 is breached. Here
Open chart in a new window
Double Top
was formed on 06.06 at 09:25:02 (UTC+0)
signal strength 1 of 5
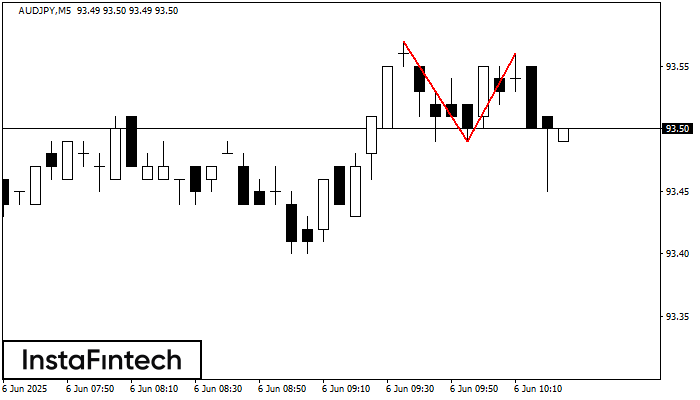
On the chart of AUDJPY M5 the Double Top reversal pattern has been formed. Characteristics: the upper boundary 93.56; the lower boundary 93.49; the width of the pattern 7 points
The M5 and M15 time frames may have more false entry points.
Open chart in a new window


