

Corak sebenar

Double Bottom
was formed on 16.04 at 08:35:10 (UTC+0)
signal strength 1 of 5
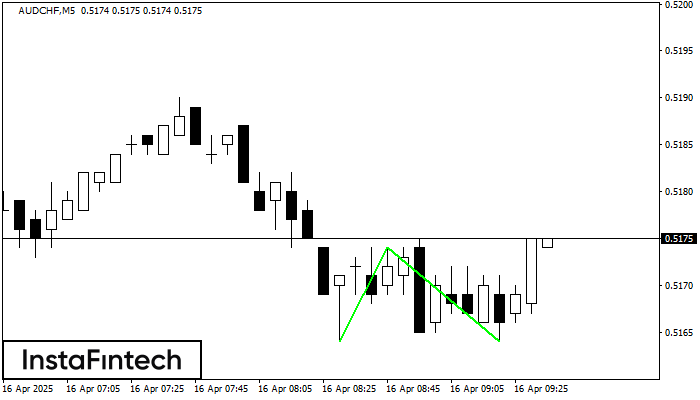
The Double Bottom pattern has been formed on AUDCHF M5. Characteristics: the support level 0.5164; the resistance level 0.5174; the width of the pattern 10 points. If the resistance level is broken, a change in the trend can be predicted with the first target point lying at the distance of 10 points.
The M5 and M15 time frames may have more false entry points.
Juga lihat
- All
- All
- Bearish Rectangle
- Bearish Symmetrical Triangle
- Bearish Symmetrical Triangle
- Bullish Rectangle
- Double Top
- Double Top
- Triple Bottom
- Triple Bottom
- Triple Top
- Triple Top
- All
- All
- Buy
- Sale
- All
- 1
- 2
- 3
- 4
- 5
Triple Top
was formed on 01.06 at 02:15:04 (UTC+0)
signal strength 2 of 5

Pada carta instrumen dagangan #Bitcoin M15, corak Triple Top yang menandakan perubahan aliran telah terbentuk. Adalah mungkin bahawa selepas pembentukan bahagian atas ketiga, harga akan cuba menembusi tahap rintangan 104215.56
Carta masa M5 dan M15 mungkin mempunyai lebih banyak titik kemasukan palsu.
Open chart in a new window
Double Top
was formed on 01.06 at 01:00:35 (UTC+0)
signal strength 3 of 5

Corak pembalikan Double Top telah dibentuk pada #Bitcoin M30. Ciri-ciri: sempadan atas %P0.000000; sempadan bawah 104800.13; sempadan bawah 104215.56; lebar corak adalah 64024 mata. Dagangan menjual adalah lebih baik untuk
Open chart in a new window
Segi Empat Menaik
was formed on 31.05 at 19:15:46 (UTC+0)
signal strength 1 of 5

Berdasarkan carta M5, #Bitcoin telah membentuk Segi Empat Menaik yang merupakan corak kesinambungan aliran. Corak adalah terkandung dalam sempadan berikut: sempadan bawah 104335.43 – 104335.43 dan sempadan atas 104800.13 –
Carta masa M5 dan M15 mungkin mempunyai lebih banyak titik kemasukan palsu.
Open chart in a new window


