

Corak sebenar

Bullish Symmetrical Triangle
was formed on 15.04 at 23:01:57 (UTC+0)
signal strength 4 of 5

According to the chart of H1, AUDJPY formed the Bullish Symmetrical Triangle pattern. Description: This is the pattern of a trend continuation. 91.35 and 90.50 are the coordinates of the upper and lower borders respectively. The pattern width is measured on the chart at 85 pips. Outlook: If the upper border 91.35 is broken, the price is likely to continue its move by 91.40.
- All
- All
- Bearish Rectangle
- Bearish Symmetrical Triangle
- Bearish Symmetrical Triangle
- Bullish Rectangle
- Double Top
- Double Top
- Triple Bottom
- Triple Bottom
- Triple Top
- Triple Top
- All
- All
- Buy
- Sale
- All
- 1
- 2
- 3
- 4
- 5
Double Top
was formed on 05.06 at 11:15:36 (UTC+0)
signal strength 1 of 5
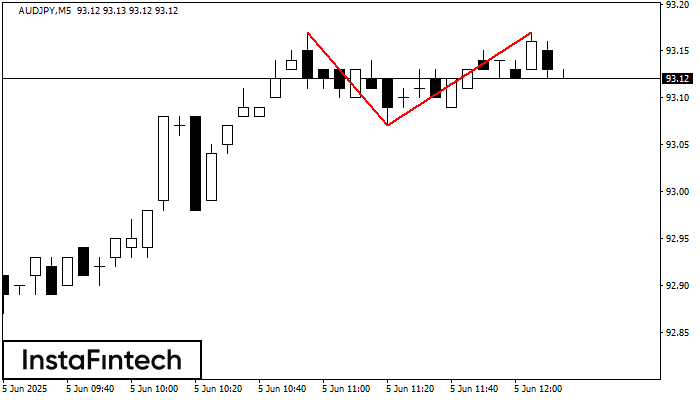
Pada carta AUDJPY M5 corak pembalikan Double Top telah terbentuk. Ciri-ciri: sempadan atas 93.17; sempadan bawah 93.07; lebar corak 10 mata. Isyarat: penembusan sempadan bawah akan menyebabkan kesinambungan arah aliran
Carta masa M5 dan M15 mungkin mempunyai lebih banyak titik kemasukan palsu.
Open chart in a new window
Segi Tiga Simetri Menurun
was formed on 05.06 at 10:19:16 (UTC+0)
signal strength 1 of 5
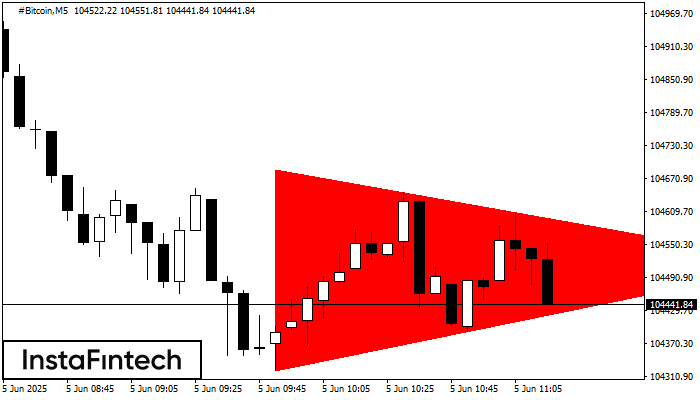
Berdasarkan carta M5, #Bitcoin membentuk corak Segi Tiga Simetri Menurun. Corak ini menandakan aliran menurun lagi dalam situasi sempadan rendah 104321.45 ditembusi. Di sini, keuntungan andaian akan sepadan dengan lebar
Carta masa M5 dan M15 mungkin mempunyai lebih banyak titik kemasukan palsu.
Open chart in a new window
Segi Tiga Simetri Menaik
was formed on 05.06 at 09:01:33 (UTC+0)
signal strength 1 of 5

Berdasarkan carta M5, SILVER membentuk corak Segi Tiga Simetri Menaik. Sempadan yang lebih rendah bagi corak yang menyentuh koordinat 34.35/34.45 di mana sempadan atas merentasi 34.55/34.45. Sekiranya corak Segi Tiga
Carta masa M5 dan M15 mungkin mempunyai lebih banyak titik kemasukan palsu.
Open chart in a new window


