

Corak sebenar

Inverse Head and Shoulder
was formed on 15.04 at 20:00:17 (UTC+0)
signal strength 3 of 5

According to the chart of M30, EURCHF formed the Inverse Head and Shoulder pattern. The Head’s top is set at 0.9269 while the median line of the Neck is found at 0.9229/0.9253. The formation of the Inverse Head and Shoulder pattern evidently signals a reversal of the downward trend. In other words, in case the scenario comes true, the price of EURCHF will go towards 0.9299
- All
- All
- Bearish Rectangle
- Bearish Symmetrical Triangle
- Bearish Symmetrical Triangle
- Bullish Rectangle
- Double Top
- Double Top
- Triple Bottom
- Triple Bottom
- Triple Top
- Triple Top
- All
- All
- Buy
- Sale
- All
- 1
- 2
- 3
- 4
- 5
Pennant Aliran Menaik
was formed on 05.06 at 08:46:29 (UTC+0)
signal strength 1 of 5
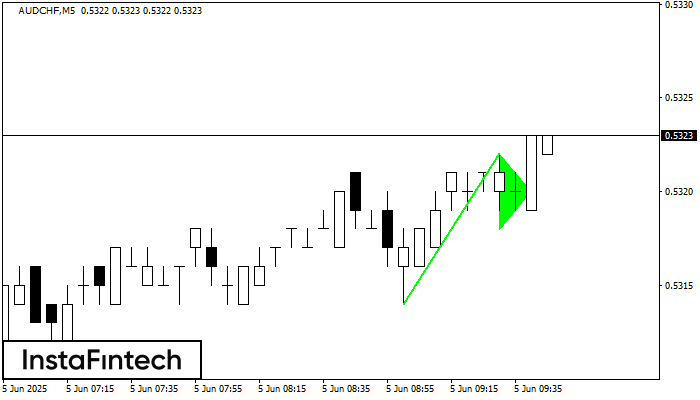
Corak Pennant Aliran Menaik adalah dibentuk pada carta AUDCHF M5. Ia adalah jenis corak kesinambungan. Seandainya, sekiranya harga adalah tetap di atas paras tinggi Pennant 0.5322, arah aliran menaik selanjutnya
Carta masa M5 dan M15 mungkin mempunyai lebih banyak titik kemasukan palsu.
Open chart in a new window
Triple Top
was formed on 05.06 at 08:40:28 (UTC+0)
signal strength 1 of 5
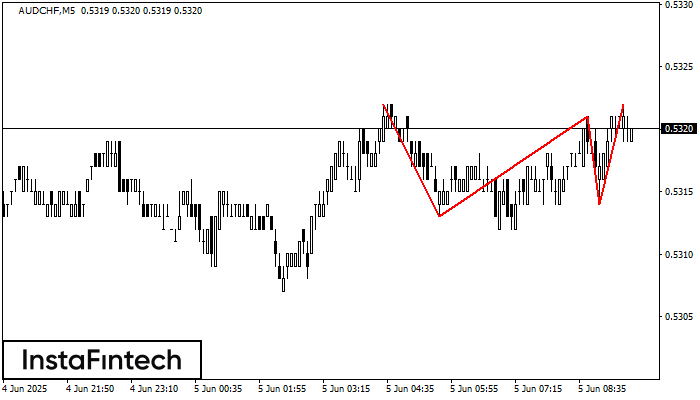
Pada carta instrumen dagangan AUDCHF M5, corak Triple Top yang menandakan perubahan aliran telah terbentuk. Adalah mungkin bahawa selepas pembentukan bahagian atas ketiga, harga akan cuba menembusi tahap rintangan 0.5313
Carta masa M5 dan M15 mungkin mempunyai lebih banyak titik kemasukan palsu.
Open chart in a new window
Segi Tiga Simetri Menaik
was formed on 05.06 at 07:50:14 (UTC+0)
signal strength 1 of 5
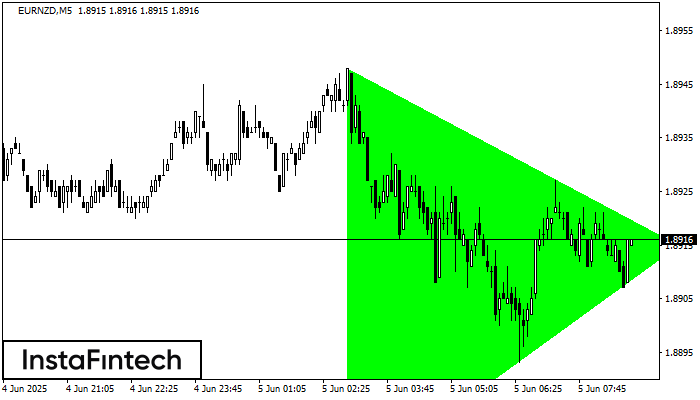
Berdasarkan carta M5, EURNZD membentuk corak Segi Tiga Simetri Menaik. Penerangan: Ini adalah corak kesinambungan aliran. 1.8948 dan 1.8870 adalah koordinat sempadan atas dan bawah masing-masing. Lebar corak diukur pada
Carta masa M5 dan M15 mungkin mempunyai lebih banyak titik kemasukan palsu.
Open chart in a new window


