

Corak sebenar

Head and Shoulders
was formed on 15.04 at 17:14:39 (UTC+0)
signal strength 2 of 5
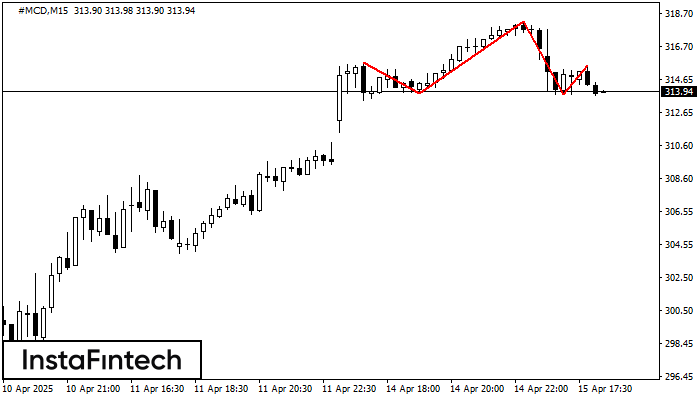
The #MCD M15 formed the Head and Shoulders pattern with the following features: The Head’s top is at 318.22, the Neckline and the upward angle are at 313.84/313.74. The formation of this pattern can bring about changes in the current trend from bullish to bearish. In case the pattern triggers the expected changes, the price of #MCD will go towards 313.52.
The M5 and M15 time frames may have more false entry points.
Juga lihat
- All
- All
- Bearish Rectangle
- Bearish Symmetrical Triangle
- Bearish Symmetrical Triangle
- Bullish Rectangle
- Double Top
- Double Top
- Triple Bottom
- Triple Bottom
- Triple Top
- Triple Top
- All
- All
- Buy
- Sale
- All
- 1
- 2
- 3
- 4
- 5
Double Bottom
was formed on 02.06 at 07:30:09 (UTC+0)
signal strength 3 of 5
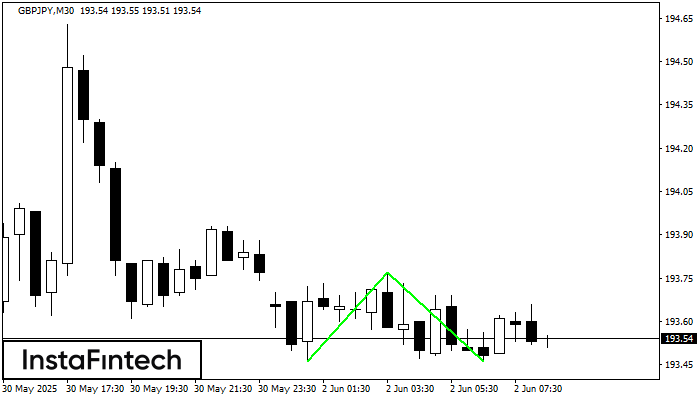
Corak Double Bottom telah dibentuk pada GBPJPY M30. Ciri-ciri: tahap sokongan 193.46; tahap rintangan 193.77; lebar corak 31 mata. Sekiranya tahap rintangan ditembusi, perubahan aliran boleh diramalkan dengan titik sasaran
Open chart in a new window
Segi Tiga Simetri Menaik
was formed on 02.06 at 07:13:52 (UTC+0)
signal strength 1 of 5
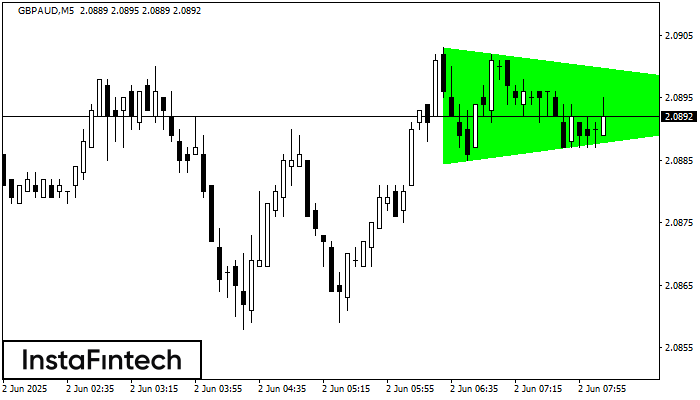
Berdasarkan carta M5, GBPAUD membentuk corak Segi Tiga Simetri Menaik yang menandakan aliran akan berterusan. Penerangan. Sempadan atas corak menyentuh koordinat 2.0903/2.0894 sedangkan sempadan bawah merentasi 2.0885/2.0894. Lebar corak diukur
Carta masa M5 dan M15 mungkin mempunyai lebih banyak titik kemasukan palsu.
Open chart in a new window
Segi Empat Menaik
was formed on 02.06 at 07:11:21 (UTC+0)
signal strength 1 of 5
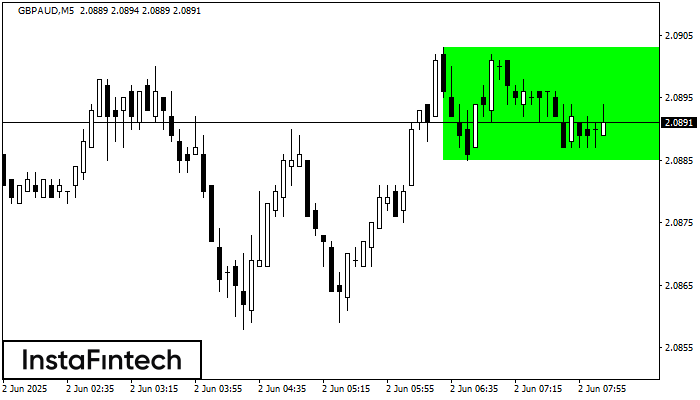
Berdasarkan carta M5, GBPAUD telah membentuk Segi Empat Menaik. Jenis corak ini menunjukkan kesinambungan aliran. Ia terdiri daripada dua tahap: rintangan 2.0903 dan sokongan 2.0885. Sekiranya tahap rintangan 2.0903
Carta masa M5 dan M15 mungkin mempunyai lebih banyak titik kemasukan palsu.
Open chart in a new window


