

Corak sebenar

Triple Top
was formed on 15.04 at 16:30:04 (UTC+0)
signal strength 3 of 5
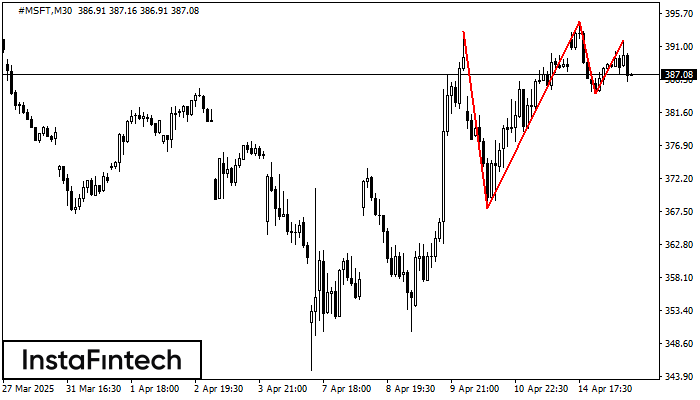
On the chart of the #MSFT M30 trading instrument, the Triple Top pattern that signals a trend change has formed. It is possible that after formation of the third peak, the price will try to break through the resistance level 367.97, where we advise to open a trading position for sale. Take profit is the projection of the pattern’s width, which is 2524 points.
- All
- All
- Bearish Rectangle
- Bearish Symmetrical Triangle
- Bearish Symmetrical Triangle
- Bullish Rectangle
- Double Top
- Double Top
- Triple Bottom
- Triple Bottom
- Triple Top
- Triple Top
- All
- All
- Buy
- Sale
- All
- 1
- 2
- 3
- 4
- 5
Bullish pennant
was formed on 05.06 at 17:30:09 (UTC+0)
signal strength 2 of 5
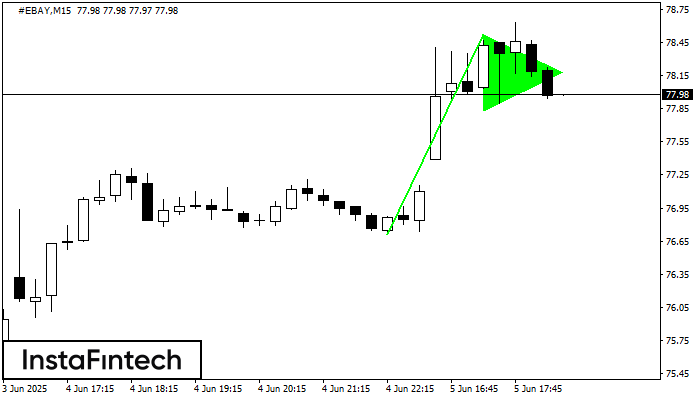
The Bullish pennant signal – Trading instrument #EBAY M15, continuation pattern. Forecast: it is possible to set up a buy position above the pattern’s high of 78.52, with the prospect
The M5 and M15 time frames may have more false entry points.
Open chart in a new window
Bearish pennant
was formed on 05.06 at 16:45:18 (UTC+0)
signal strength 2 of 5

The Bearish pennant pattern has formed on the #TSLA M15 chart. This pattern type is characterized by a slight slowdown after which the price will move in the direction
The M5 and M15 time frames may have more false entry points.
Open chart in a new window
Bearish pennant
was formed on 05.06 at 16:45:10 (UTC+0)
signal strength 2 of 5
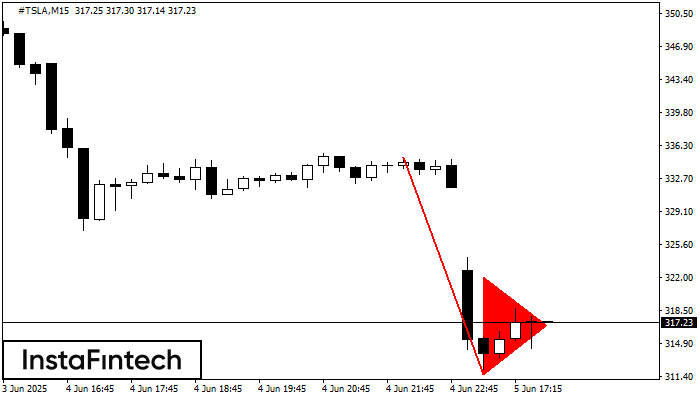
The Bearish pennant pattern has formed on the #TSLA M15 chart. It signals potential continuation of the existing trend. Specifications: the pattern’s bottom has the coordinate of 311.59; the projection
The M5 and M15 time frames may have more false entry points.
Open chart in a new window


