

Corak sebenar

Bearish Rectangle
was formed on 15.04 at 12:03:16 (UTC+0)
signal strength 1 of 5
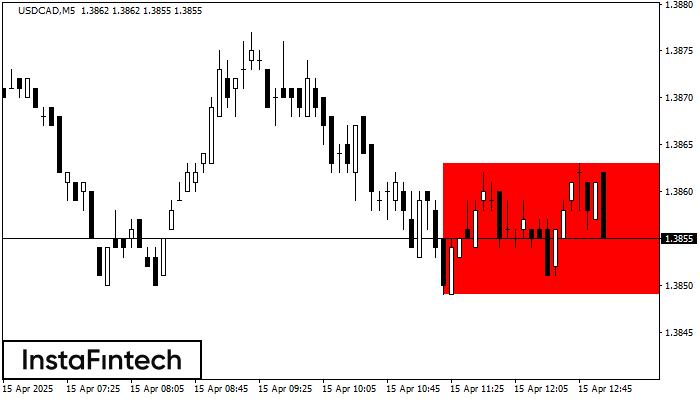
According to the chart of M5, USDCAD formed the Bearish Rectangle. The pattern indicates a trend continuation. The upper border is 1.3863, the lower border is 1.3849. The signal means that a short position should be opened after fixing a price below the lower border 1.3849 of the Bearish Rectangle.
The M5 and M15 time frames may have more false entry points.
- All
- All
- Bearish Rectangle
- Bearish Symmetrical Triangle
- Bearish Symmetrical Triangle
- Bullish Rectangle
- Double Top
- Double Top
- Triple Bottom
- Triple Bottom
- Triple Top
- Triple Top
- All
- All
- Buy
- Sale
- All
- 1
- 2
- 3
- 4
- 5
ট্রিপল টপ
was formed on 03.06 at 00:30:20 (UTC+0)
signal strength 3 of 5
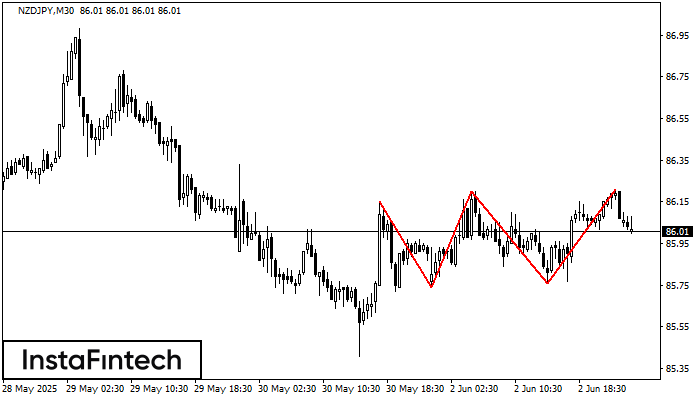
M30 চার্টে NZDJPY-এর ট্রিপল টপ প্যাটার্নটি গঠিত হয়েছে। প্যাটার্নের বৈশিষ্ট্য: এই প্যাটার্নের সীমানাগুলোতে একটি ঊর্ধ্বমুখী অ্যাঙ্গেল বা কোণ আছে; প্যাটার্নের নীচের লাইনে 85.74/85.76-এর কোঅর্ডিনেট রয়েছে, উপরের সীমা 86.15/86.21; প্রস্থের প্রজেকশন
Open chart in a new window
ট্রিপল বটম
was formed on 03.06 at 00:05:20 (UTC+0)
signal strength 1 of 5

M5 চার্টে USDJPY-এর ট্রিপল বটম প্যাটার্নটি গঠিত হয়েছে। প্যাটার্নের বৈশিষ্ট্য: প্যাটার্নের নীচের লাইনে কোঅর্ডিনেট 142.75 রয়েছে এবং এটির উপরের সীমা 142.75/142.69, প্রস্থের প্রজেকশন হল 7 পয়েন্ট। ট্রিপল বটম প্যাটার্নের
M5 এবং M15 টাইম ফ্রেমে আরও ভুল এন্ট্রি পয়েন্ট থাকতে পারে।
Open chart in a new window
ট্রিপল বটম
was formed on 03.06 at 00:00:22 (UTC+0)
signal strength 3 of 5
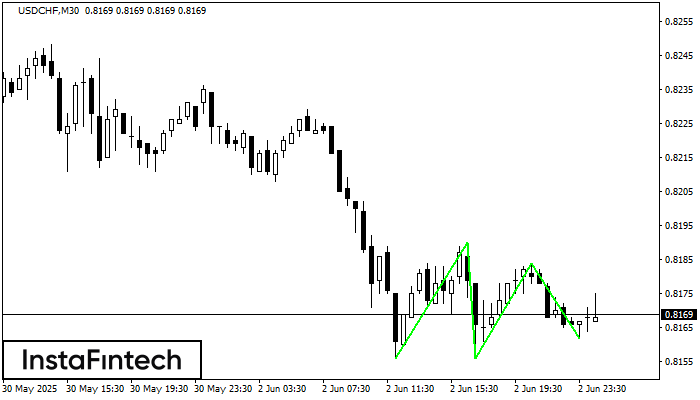
M30 চার্টে, USDCHF ট্রেডিং ইন্সট্রুমেন্টের ট্রিপল বটম প্যাটার্ন গঠিত হয়েছে। 0.8190/0.8184 ব্রেকডাউনের ক্ষেত্রে এই প্যাটার্ন নিম্নমুখী প্রবণতা থেকে ঊর্ধ্বমুখী প্রবণতায় পরিবর্তনের সংকেত দেয়৷
Open chart in a new window

